Navigating Real Estate in Ohio: A Comprehensive Guide

Welcome to our dedicated blog where we dive deep into the nuances of the real estate markets in Ohio. Whether you're buying your first home, seeking investment properties, or exploring market trends, our insights will guide you through every step of your real estate journey.

Ohio Real Estate Overview

Ohio's real estate market offers a diverse range of options from bustling city apartments in Columbus to serene suburban homes in Fairfield County. The state's affordable cost of living combined with growing job opportunities makes it an attractive market for first-time homebuyers and investors alike.

Market Trends

  • Ohio: Current trends indicate a rise in demand for suburban homes as more individuals seek properties with more space and access to nature.

Investment Opportunities

  • Ohio: Look for burgeoning markets in smaller cities and suburbs where property values are set to rise.

Buying and Selling Tips

  • For Buyers: Consider your long-term goals. In Ohio, focus on community-driven areas with good schools and infrastructure. 
  • For Sellers: Highlight unique property features. In Ohio, emphasize space and community amenities. 

This content structure provides a thorough introduction to the real estate landscapes of both states, catering to various interests from home buyers to investors.

Sept. 1, 2026

East Cleveland Ohio Real Estate Market Report – August 2026

East Cleveland Ohio Real Estate Market Report August 2026

Thirteen homes closed in the East Cleveland market area recently. That is a small enough number that it changes how this report has to be written: with thirteen transactions, a single sale moves the average by thousands of dollars, so the median — $95,000 — is the more honest figure, and everything below should be read as an indication rather than a measurement. Sale prices ranged from $18,000 to $399,900. There are 26 homes available against 12 under contract, and recent sales took an average of 100 days to reach a contract.

East Cleveland Ohio Market Snapshot – August 2026

Active ListingsUnder ContractRecent ClosingsMedian Sale Price
261213$95,000
Average Sale PriceSale Price RangeSale-to-List (median)Avg Days on Market
$121,830$18,000 – $399,900~96%100 (sold)
Avg Beds (Sold)Avg Baths (Sold)Avg Living Area (Sold)Est. Monthly P&I (median)
3.31.51,437 sq ft~$488

Source: East Cleveland, Ohio Real Estate Market Report, MLS Now data as of August 2026. Median, range, and sale-to-list distribution calculated from the 13 individually detailed closings. Monthly payment assumes 20% down at 6.65%, principal and interest only. Small sample — see below.

Why the Sample Size Matters Here

Most of the market reports in this series draw on 70 to 800 recent closings. East Cleveland has thirteen, and four of those records carry no square-footage figure.

That has real consequences for how the numbers should be used. One $399,900 sale in a set of thirteen pulls the average up by roughly $23,000 all by itself — which is most of the difference between the $121,830 average and the $95,000 median. Neither figure is wrong; they are answering different questions, and with a sample this thin, the median is the one that describes a typical transaction.

The practical instruction is simple: do not price a specific East Cleveland property from any citywide figure, including the ones in this report. Pull the comparable sales for that street and that housing type. In a market this small, the citywide average is context, not valuation.

A Wide Spread, Driven by Condition

Across the thirteen detailed closings, sale-to-list ratios ranged from 77% to 118%, with a median near 96%. That is an unusually wide spread. In most markets covered here, two-thirds of sales land between 95% and 105% of asking.

A spread like that says outcomes are being driven by the individual property rather than by any citywide market rate. In a housing stock built largely in the early twentieth century, the difference between a home with a sound roof, updated electrical service, and a working furnace and one without is not a matter of a few percent — it is the whole transaction.

The days-on-market figures are consistent with a deliberate market: 100 days from list to contract on recent closings, 131 days for homes currently under contract, and 64 days for the active listings. With 26 homes available against 12 committed — a ratio of 2.17 — buyers have inventory and time.

What a Buyer Actually Needs to Check

At a median under $100,000, the purchase price is rarely the main determinant of what a house costs. Four things matter more, and all of them are property-specific rather than market-wide:

Condition. Roof, furnace, electrical service, plumbing, and foundation. A thorough inspection by someone experienced with early-twentieth-century Cleveland-area housing is the most important money spent before closing, and a repair reserve should be part of the budget from the start rather than a contingency you hope not to need.

Taxes and title. Verify the current tax status and confirm clear title on the specific parcel. This is standard practice anywhere, and it is worth being especially deliberate about it in any market with a history of vacancy or transfers outside ordinary sales.

Point-of-sale requirements. Many inner-ring Cuyahoga County communities have inspection or escrow requirements attached to a sale. Find out what applies to the address early — discovering it mid-transaction is one of the most common avoidable delays in this county.

Financing. This one surprises people. Many lenders set minimum loan amounts that a $76,000 mortgage may fall below, and appraisals in markets with few recent comparable sales can come in under contract price or flag required repairs. If you intend to finance rather than pay cash, speak to a lender about this specific price range and this specific area before you begin writing offers.

Ohio Context and Mortgage Rates

Statewide, the Ohio REALTORS July 2026 report put the median Ohio sale price at $285,000, up 3.6% year over year, across 12,723 sales, with 39,641 active listings and 3.72 months of supply. East Cleveland’s $95,000 median sits at roughly a third of the statewide figure.

Freddie Mac reported the 30-year fixed averaging 6.65% and the 15-year 5.95% as of August 20, 2026, a second consecutive weekly decline. On a $76,000 loan that works out to roughly $488 a month in principal and interest.

At this price point, however, taxes and insurance are the larger share of the monthly cost, and they vary substantially by parcel. Get the actual figures for any address you are considering rather than estimating from the sale price — the difference between two similar houses can be considerable.

East Cleveland Market Breakdown by Property Type

Featured East Cleveland Neighborhoods

East Cleveland is built from early-twentieth-century allotments, and condition and pricing vary considerably between them:

Colonial Heights · Doan Tract · Euclid Colamer · Euclid Hayden · Euclid Shaw · Forest Hills · George Davies · Glynn Road · Grasmere Add · House Codys · James Eadias · Jas Mccrosky · Leonard Park · Milan Hayden · Panoramic View · Rapid Transit · Ridgefield Road · Saint Clair Heights · St Clair-Hayden · Stcl Hay

What This Means If You Are Buying

Value the property, not the city. With thirteen recent closings spread across a $382,000 range, no citywide number will tell you what a specific house is worth. Comparable sales on the street and in the same condition tier are the only reliable guide.

Budget for the house, not the price. Set aside meaningful funds for inspection findings before you commit to a purchase price.

Line up financing first. Confirm your lender will write a loan at this size in this area before you make offers.

Use the time. Twenty-six listings, a 100-day pace, and a 2.17 supply ratio mean there is no need to rush a decision here.

What This Means If You Are Selling

Expect a longer timeline — recent closings averaged 100 days to contract and homes currently under contract took 131. Twenty-five other homes compete with you.

Condition is doing more work than price in determining outcomes. The sale-to-list spread of 77% to 118% across just thirteen sales tells you that buyers here are pricing the specific property, not the market. Documented recent mechanical work, a clean inspection history, and clear title are worth more at the negotiating table than a lower asking price.

Confirm point-of-sale inspection requirements for your address before listing, and be prepared for buyers who may need financing contingencies that take longer than usual to satisfy.

How East Cleveland Compares Nearby

  • Cleveland Heights — $252,356 average sale, 89 active, 41 pending, $121/sq ft
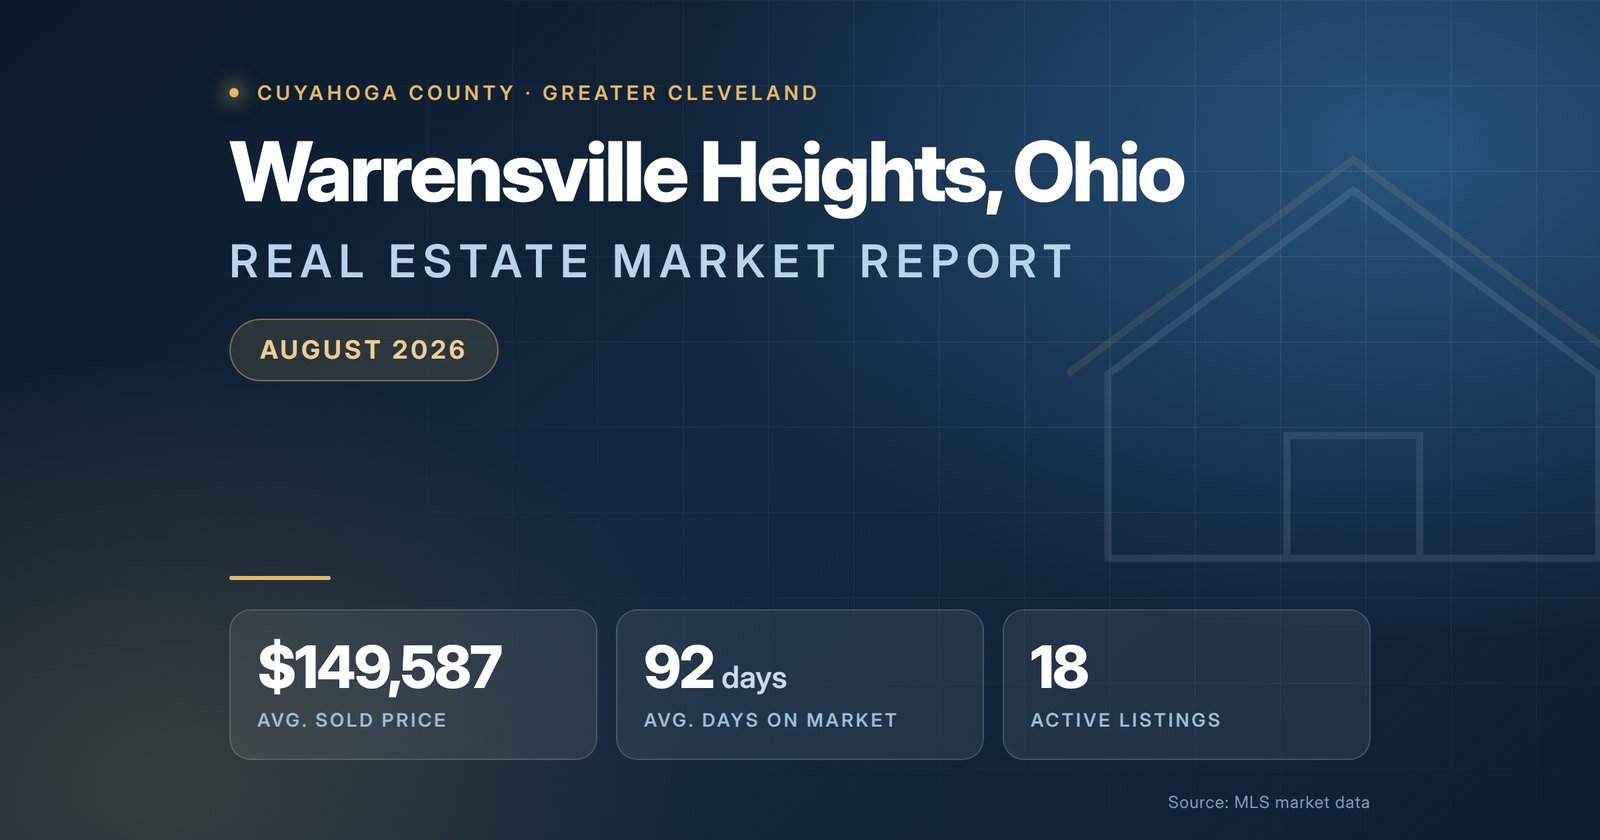
  • Warrensville Heights — $149,587 average sale, 18 active, 10 pending, $98/sq ft
  • Garfield Heights — $148,186 average sale, 63 active, 35 pending, $95/sq ft
  • Maple Heights — $139,984 average sale, 39 active, 23 pending, $97/sq ft
  • East Cleveland — $95,000 median sale (13 closings), 26 active, 12 pending
  • Cleveland — the citywide market, with far deeper inventory and volume

Cleveland Heights shares East Cleveland’s western border and closes at more than two and a half times the price, on a similar vintage of housing stock. For a buyer weighing the two, the relevant difference is not the architecture — it is everything about condition, taxes, services, and resale that the price gap represents.

Maple Heights and Garfield Heights are the closest comparisons on price among markets with enough transaction volume to produce reliable averages, and both offer considerably more inventory.

Frequently Asked Questions

What is the average home price in East Cleveland, Ohio?

Across 13 recent closings, the average was $121,830 and the median $95,000. The gap matters: sale prices ranged from $18,000 to $399,900, and a single high sale lifts the average well above what a typical transaction looks like. With a sample this small, the median is the number to work from.

How much is the monthly payment on a typical East Cleveland home?

At the $95,000 median sale price with 20% down and the Freddie Mac 30-year average of 6.65% as of August 20, 2026, principal and interest come to roughly $488 per month on a $76,000 loan. At the $121,830 average, roughly $626. Cuyahoga County property taxes and homeowners insurance are additional and are a very large proportion of the total payment at this price level — potentially exceeding the mortgage payment itself on some parcels.

Why should I be careful with East Cleveland market statistics?

Because the sample is small. Only 13 homes closed in this market area recently, and four of those records carry no square-footage figure. Averages built on thirteen transactions move sharply with any one of them. Every figure in this report should be read as an indication of the market rather than a precise measure, and any specific property should be valued on its own comparable sales.

Can you negotiate on price in East Cleveland?

Yes, substantially in some cases. Across the individually detailed closings the sale-to-list ratios ranged from 77% to 118%, with a median near 96%. That spread is wide, and it reflects how much individual property condition drives outcomes here rather than any citywide market rate.

Is East Cleveland a buyer or a seller market?

Buyers hold the leverage on supply. There are 26 active listings against 12 under contract — a ratio of 2.17 — and recent closings took an average of 100 days to reach a contract, with pending sales averaging 131 days. This is a slow-moving market with real inventory.

What should a buyer look at most carefully in East Cleveland?

Three things above all. Condition — at a median under $100,000, the roof, furnace, electrical service, plumbing, and foundation determine the true cost of the house, and a thorough inspection is essential. Title and back taxes — verify the tax status and clear title on any specific parcel before committing. Point-of-sale requirements — find out early what inspection or escrow requirements apply to the address, because discovering them mid-transaction is a common cause of delay.

Can you get a mortgage on a home at this price point?

It can be harder than buyers expect. Many lenders set minimum loan amounts, and appraisals in markets with few recent comparable sales can come in below contract price or flag required repairs. If you intend to finance rather than pay cash, talk to a lender about this specific price range and this specific area before you start writing offers.

How does East Cleveland compare to nearby suburbs?

It is the lowest-priced market in its immediate area. Recent closings there median $95,000, against averages of $139,984 in Maple Heights, $148,186 in Garfield Heights, and $149,587 in Warrensville Heights — and $365,734 in Cleveland Heights, which shares its western border.

Get a Personalized East Cleveland Market Analysis

East Cleveland is the market in this series where a citywide average is least useful. Thirteen closings across a $382,000 range cannot tell you what a specific house is worth, and no automated valuation tool handles a market this thin well.

If you are buying, I can pull the comparable sales that genuinely apply to a specific property, tell you what to have inspected and what it is likely to cost, and be honest with you about whether the financing is likely to work. If you are selling, I will give you a realistic price and a realistic timeline rather than an optimistic one.

Contact Christopher Lotte to get started, or browse the full East Cleveland, Ohio real estate market report for the underlying listing-level data.

Sources: MLS Now via the East Cleveland Ohio Market Report (August 2026) · Ohio REALTORS July 2026 Housing Report · Freddie Mac Primary Mortgage Market Survey, August 20, 2026. Median, price range, and sale-to-list distribution were calculated from the 13 individually detailed closings shown on the market report page. Because that sample is small, these figures indicate the market rather than measure it precisely, and are not a substitute for a professional valuation of a specific property.

Christopher Lotte, Realtor

Sept. 1, 2026

Warrensville Heights Ohio Real Estate Market Report – August 2026

Warrensville Heights Ohio Real Estate Market Report August 2026

The recent closing data for Warrensville Heights describes a slow market: 92 days from listing to contract, sales landing $4,400 below asking, and 18 homes available against 10 under contract. The pending data describes a different one. Homes currently under contract got there in 52 days — forty days faster — at about 15% more per square foot. Those two pictures are hard to reconcile, and the more recent one is the pending cohort.

Warrensville Heights Ohio Market Snapshot – August 2026

Active ListingsUnder ContractRecent ClosingsAvg Sale Price
181041$149,587
Avg List Price (Active)Avg Price / Sq Ft (Sold)Sale-to-List RatioAvg Days on Market
$191,336$9897.1%92 (sold)
Avg Beds (Sold)Avg Baths (Sold)Avg Living Area (Sold)Est. Monthly P&I
2.91.81,540 sq ft$768

Source: Warrensville Heights, Ohio Real Estate Market Report, MLS Now data as of August 2026. Monthly payment assumes 20% down at 6.65%, principal and interest only.

The Pipeline Is Moving Faster and Pricing Higher

Set the two most recent segments side by side:

  • Recently closed — $149,587 average sale, $98 per square foot, 92 days to contract
  • Under contract now — $192,270 average list, $113 per square foot, 52 days to contract

Pending sales are, by definition, more recent than closed ones. When they reach contract forty days faster and at 15% more per square foot, that is a market picking up rather than settling.

The honest caveat: there are only ten pending sales. That is a small sample, and a handful of well-priced homes could account for the whole difference. This is a signal worth watching in next month’s data, not a conclusion to act on as settled fact.

But it does change how to read the headline figures. A buyer planning an offer strategy around the 97.1% sale-to-list ratio should know that ratio reflects transactions negotiated a season ago, under conditions the pending cohort does not obviously share.

Seven Hundred Sixty-Eight Dollars a Month

At the $149,587 average closing price with 20% down, principal and interest run about $768 a month on a $119,670 loan — among the lowest monthly figures of any market in this series, for a home averaging 1,540 finished square feet in inner-ring Cuyahoga County.

Two things belong immediately alongside that number.

First, at this price point Cuyahoga County property taxes and homeowners insurance are not a rounding error — they can represent a substantial fraction of the total monthly cost, and they vary by parcel. Get the actual figures for any specific address rather than estimating from the sale price.

Second, at $98 per square foot you are buying older housing stock where condition varies enormously from one property to the next. The roof, the furnace, the electrical service, and the foundation determine whether an inexpensive house is genuinely inexpensive. A thorough inspection is the most important money spent before closing, and a repair reserve should be part of the budget rather than a hope.

Location Is the Underrated Asset Here

Warrensville Heights is bordered by some of the most expensive real estate on Cleveland’s east side. Shaker Heights closes at $138 per square foot; Beachwood at $193. Warrensville Heights sits at $98, with direct access to the I-271 and I-480 interchanges and the Chagrin Highlands employment corridor.

That proximity is the structural argument for this market. The commute to the eastern job cluster is short, the entry price is a fraction of the neighboring communities’, and the transaction volume — 41 recent closings in a city of 13,545 — shows a market that functions rather than one that has stalled.

It is also, plausibly, part of why the pending cohort is moving faster and paying more.

Ohio Context and Mortgage Rates

Statewide, the Ohio REALTORS July 2026 report put the median Ohio sale price at $285,000, up 3.6% year over year, across 12,723 sales, with 39,641 active listings and 3.72 months of supply. Warrensville Heights closes about 48% below that median.

Freddie Mac reported the 30-year fixed averaging 6.65% and the 15-year 5.95% as of August 20, 2026, a second consecutive weekly decline. On a $119,670 loan that is roughly $768 a month in principal and interest; the difference between 7.00% and 6.65% is about $28 a month here.

Rate movements are not what drives this market. Condition, taxes, and absorption are.

Warrensville Heights Market Breakdown by Property Type

What This Means If You Are Buying

Negotiate, but do not assume the discount is still there. Recent closings came in 2.9% under asking; the pending cohort is paying more per foot. Ask, but be ready to move on a well-priced home.

Inspect thoroughly and budget for what it finds. At $98 per square foot the purchase price is the smaller part of the decision. This is the single most important line in this report.

Get the real tax figure. Cuyahoga County taxes at this price level materially change the monthly picture, and they are not uniform across the city.

Understand the point-of-sale requirements. Many inner-ring Cuyahoga communities have inspection requirements that affect the transaction. Find out what applies to a specific address early rather than during escrow.

What This Means If You Are Selling

Recent closings took about three months to reach a contract, so plan a season rather than a month. Seventeen other homes compete with you citywide, and buyers at this price point are careful.

The encouraging read is in the pending data: homes going under contract now are doing so faster and at higher per-foot prices than the ones that closed. Pricing to the recent closings alone may leave money on the table — it is worth looking hard at what is actually under contract before setting a number.

Condition carries disproportionate weight here. In a market where buyers are budgeting for repairs, a home with recent mechanical work and a documented history sells faster and closer to asking than a comparable one without.

How Warrensville Heights Compares Nearby

  • Shaker Heights — $365,734 average sale, 82 active, 21 pending, $138/sq ft
  • Bedford Heights — $221,558 average sale, 13 active, 12 pending, $134/sq ft
  • Bedford — $171,826 average sale, 16 active, 14 pending, $113/sq ft
  • Warrensville Heights — $149,587 average sale, 18 active, 10 pending, $98/sq ft
  • Garfield Heights — $148,186 average sale, 63 active, 35 pending, $95/sq ft
  • Maple Heights — $139,984 average sale, 39 active, 23 pending, $97/sq ft

Warrensville Heights, Garfield Heights, and Maple Heights are priced within three dollars per square foot of each other — $95 to $98 — and are effectively one market on value. What separates them is inventory: Garfield Heights has 63 active listings and Maple Heights 39, against 18 here. A buyer wanting selection at this price point will find more of it there.

Bedford is the step up at 15% more per foot, and Bedford Heights at 37% more.

Frequently Asked Questions

What is the average home price in Warrensville Heights, Ohio?

Recent closed sales in the Warrensville Heights market area averaged $149,587, or about $98 per square foot on an average of 1,540 finished square feet. That is roughly 48% below the Ohio statewide median of $285,000.

How much is the monthly payment on an average Warrensville Heights home?

At the $149,587 average closing price with 20% down and the Freddie Mac 30-year average of 6.65% as of August 20, 2026, principal and interest come to roughly $768 per month on a $119,670 loan — among the lowest monthly figures of any market covered in this series. Cuyahoga County property taxes and homeowners insurance are additional and are a large proportion of the total payment at this price level.

Can you negotiate on price in Warrensville Heights?

Yes. The average sale closed at 97.1% of list — about $4,400 below asking. With 18 active listings against 10 under contract and recent closings taking 92 days to reach a contract, buyers have both selection and room.

Are prices in Warrensville Heights rising?

The pipeline suggests movement. Homes currently under contract are priced at about $113 per square foot against $98 on recently closed sales — roughly 15% higher — and they went under contract in an average of 52 days against the 92 days recent closings took. With only ten pending sales this is a small sample and should be read as a signal rather than a conclusion, but both figures point the same direction.

Is Warrensville Heights a buyer or a seller market right now?

The completed transactions favor buyers — an active-to-pending ratio of 1.80, sales about 3% below asking, and a 92-day pace. The pending data is less clear-cut, with faster contracts at higher per-foot prices. This is a market worth watching rather than one with a settled answer.

How does Warrensville Heights compare to nearby suburbs?

It sits toward the affordable end of the eastern inner-ring group. At $98 per square foot it is above Garfield Heights ($95) and Maple Heights ($97) and below Bedford ($113) and Bedford Heights ($134). Shaker Heights, immediately north, closes at $138 per square foot on much larger homes.

How long do homes take to sell in Warrensville Heights?

Recent closings averaged 92 days from list to contract — about three months. Homes currently under contract got there faster, in 52 days, and active listings have been out 67 days. Sellers should plan for a season rather than a month.

Is Warrensville Heights a good market for investors?

The entry price is among the lowest in Cuyahoga County at about $98 per square foot, and its location beside the Chagrin Highlands corridor and the I-271 employment cluster is a genuine advantage. The counterweights are pace — three months to contract on recent closings — and older housing stock where condition varies widely. Verify actual rents, Cuyahoga County tax rates, point-of-sale inspection requirements, and property condition before underwriting anything.

Get a Personalized Warrensville Heights Market Analysis

At $98 per square foot, the difference between a good purchase and an expensive one in Warrensville Heights is almost never the price — it is the mechanical systems, the roof, and the foundation. Two houses on the same street at the same number can be tens of thousands of dollars apart in real cost.

If you are buying, I can tell you which of the current listings are genuinely worth pursuing, what to look hard at, and what a supportable offer looks like given that the pipeline is running ahead of the closings. If you are selling, I will price your home against real comparable sales and factor in the pending activity rather than only the recorded ones.

Contact Christopher Lotte to get started, or browse the full Warrensville Heights, Ohio real estate market report for the underlying listing-level data.

Sources: MLS Now via the Warrensville Heights Ohio Market Report (August 2026) · Ohio REALTORS July 2026 Housing Report · Freddie Mac Primary Mortgage Market Survey, August 20, 2026. Figures are averages for the Warrensville Heights market area as reported by the MLS and are not a substitute for a professional valuation.

Christopher Lotte, Realtor

Sept. 1, 2026

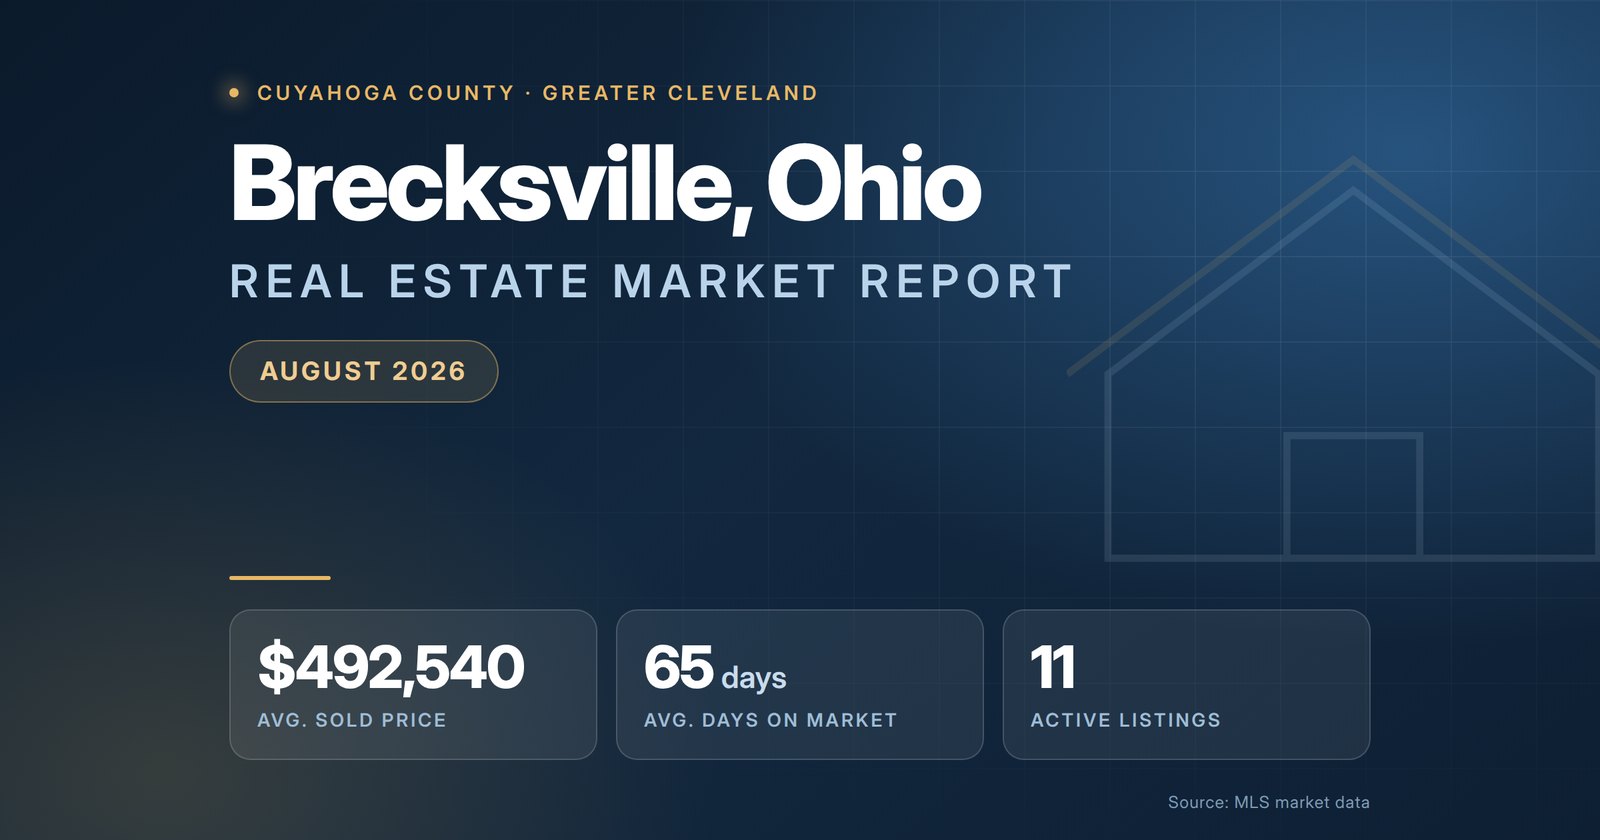
Brecksville Ohio Real Estate Market Report – August 2026

Brecksville Ohio Real Estate Market Report August 2026

There are eleven homes for sale in Brecksville. Twenty-five are already under contract. That ratio — 0.44 — is the tightest supply of any market covered in this series. And the homes going under contract are priced 16% higher per square foot than the ones that recently closed. Brecksville is running out of inventory and the pipeline is repricing upward at the same time.

Brecksville Ohio Market Snapshot – August 2026

Active ListingsUnder ContractRecent ClosingsAvg Sale Price
112573$492,540
Avg List Price (Active)Avg Price / Sq Ft (Sold)Sale-to-List RatioActive : Pending Ratio
$563,018$16698.9%0.44
Avg Beds (Sold)Avg Baths (Sold)Avg Living Area (Sold)Est. Monthly P&I
3.43.03,039 sq ft$2,530

Source: Brecksville, Ohio Real Estate Market Report, MLS Now data as of August 2026. Recent closings averaged 65 days from list to contract; active listings have been out 46 days. Monthly payment assumes 20% down at 6.65%, principal and interest only.

Eleven Homes, in a City of 13,692

Seventy-three homes have closed recently. Twenty-five are under contract. Eleven are available.

The active-to-pending ratio of 0.44 means more than two Brecksville homes are already committed for every one a buyer can walk into. Across the markets in this series, that is the tightest figure recorded — tighter than Stow at 0.46, tighter than Willowick at 0.64, tighter than Berea at 0.74.

The days-on-market data confirms the direction. Active listings have been out only 46 days, against 65 days for recent closings and 67 for pendings. The available inventory is the freshest segment, which happens only when homes are being absorbed as fast as they arrive.

Brecksville is a large-lot suburb along the Cuyahoga Valley rim with limited capacity to add housing. The supply is what it is, and right now the market is working through it faster than it is being replaced.

The Pipeline Is Repricing Upward

This is the more consequential finding, and it runs against the closed data. Compare the three segments:

  • Recently closed — 3,039 sq ft, sold $492,540, $166 per square foot
  • Active listings — 2,750 sq ft, asking $563,018, $195 per square foot
  • Under contract now — 3,566 sq ft, asking $728,527, $192 per square foot

The homes buyers are actually committing to are running 16% above recent closings on a per-square-foot basis, and they are 17% larger. Pending sales are a more recent cohort than closed ones — so when they price this far above them, it is a forward signal, not a composition quirk.

Notice too that the pending and active per-foot rates are nearly identical, at $192 and $195. Buyers are not rejecting the current asking prices. They are accepting them, and the closings that will be reported next month should reflect that.

Twenty-five pending sales is a real sample, not a handful. This is worth taking seriously in both directions.

The Buyer Discount Is Backward-Looking

Recent Brecksville closings landed at 98.9% of list — about $5,476 below asking. Taken alone, that reads as a market where buyers have leverage.

It should be read alongside the timing. Those transactions were negotiated when there was more inventory available than there is now. The current conditions — eleven listings, twenty-five under contract, pendings priced 16% higher per foot — do not describe a market where buyers are extracting concessions.

If you are planning an offer strategy in Brecksville around a 1% discount because the published data supports it, the published data is describing a market state that has already moved on.

Same Price Per Foot as Broadview Heights, Opposite Inventory

Brecksville and Broadview Heights share a border and cost exactly the same per square foot: $166 in both. Their inventory conditions could hardly be more different.

  • Brecksville — 11 active, 25 pending (ratio 0.44), 3,039 sq ft average sale
  • Broadview Heights — 30 active, 16 pending (ratio 1.88), 2,553 sq ft average sale

A buyer standing on the Broadview Heights side of that line has nearly three times the selection at identical value per foot. Brecksville’s higher average sale price is a size difference — its homes run roughly 500 square feet larger — not a difference in what a square foot is worth.

If you want the scale of Brecksville housing and cannot find it among eleven listings, that is where to look next.

Ohio Context and Mortgage Rates

Statewide, the Ohio REALTORS July 2026 report put the median Ohio sale price at $285,000, up 3.6% year over year, across 12,723 sales, with 39,641 active listings and 3.72 months of supply. Brecksville closes about $208,000 above that median, and eleven listings against seventy-three recent closings is a fraction of a single month of supply.

Freddie Mac reported the 30-year fixed averaging 6.65% and the 15-year 5.95% as of August 20, 2026, a second consecutive weekly decline. On a $394,032 loan that is roughly $2,530 a month in principal and interest, with the move from 7.00% to 6.65% worth about $93 a month.

A further rate decline here would most likely intensify competition for the same eleven houses rather than produce more of them.

Brecksville Market Breakdown by Property Type

Featured Brecksville Neighborhoods

Brecksville is built out of large-lot subdivisions along the valley rim, and pricing varies between them:

Bradford Village · Brecksville Place · Brecksville Pointe · Cambridge Village · Carriage Hill · Carters Grove · Chapel Hills · Chippewa Creek · Chippewa Hills · Chippewa Village Estates · Conifer Acres · Counrty Woods · Cransbury Creek Park · Crane Creek · Crane Park · Crosswinds Village · Deer Path Estates · Echo Hills Estates · Emerald Woods · Farnham Acres

What This Means If You Are Buying

Eleven listings is a watch, not a search. You are waiting for the right home to appear and being ready when it does. Instant alerts and same-day viewing are the strategy.

Do not anchor on the 98.9% figure. That discount was available to buyers transacting under looser conditions. The pending data suggests the current market is not offering it.

Be fully approved before you look. With twenty-five homes already committed against eleven available, the buyer who can write immediately and close cleanly is the one who gets the house.

Know your alternative. Broadview Heights sits next door at identical per-foot pricing with thirty listings. If Brecksville does not open up, that is the move.

What This Means If You Are Selling

This is close to the strongest position a Brecksville seller has had. Ten other homes compete with you citywide, and buyers are committing to properties priced 16% per foot above where the last round of closings landed.

Do not price off the closed comparable sales alone. At $166 per square foot, recent closings describe a market state that the pending activity has already moved past. A valuation here should look hard at what is under contract, not only at what has recorded.

That said, price to draw buyers rather than to capture the whole move at once — eleven listings means yours will be seen, but a number well beyond what the pending cohort supports still stalls.

Confirm Cuyahoga County point-of-sale inspection requirements for your address before you list.

How Brecksville Compares Nearby

  • Brecksville — $492,540 average sale, 11 active, 25 pending, $166/sq ft, 3,039 sq ft
  • Independence — $439,338 average sale, 11 active, 7 pending, $173/sq ft
  • Broadview Heights — $402,935 average sale, 30 active, 16 pending, $166/sq ft
  • Strongsville — $394,742 average sale, 53 active, 55 pending, $160/sq ft
  • Seven Hills — $355,307 average sale, 14 active, 17 pending, $147/sq ft
  • North Royalton — $345,164 average sale, 41 active, 44 pending, $148/sq ft

The whole southern Cuyahoga group sits between $147 and $173 per square foot — a narrow band. What separates their average sale prices is house size, and Brecksville sells the largest homes of the six.

Strongsville is the practical alternative for selection, with fifty-three active listings at 4% less per foot. North Royalton is where the per-foot rate genuinely steps down, about 11% below Brecksville.

Frequently Asked Questions

What is the average home price in Brecksville, Ohio?

Recent closed sales in the Brecksville market area averaged $492,540, or about $166 per square foot on an average of 3,039 finished square feet — among the largest average home sizes in Cuyahoga County. That is roughly $208,000 above the Ohio statewide median.

How much is the monthly payment on an average Brecksville home?

At the $492,540 average closing price with 20% down and the Freddie Mac 30-year average of 6.65% as of August 20, 2026, principal and interest come to roughly $2,530 per month on a $394,032 loan. Cuyahoga County property taxes and homeowners insurance are additional and are substantial at this price level.

How many homes are for sale in Brecksville?

Eleven. Against 25 already under contract and 73 recent closings, that gives an active-to-pending ratio of 0.44 — the tightest supply of any market covered in this series. More than twice as many Brecksville homes are spoken for as are available to view.

Are prices in Brecksville rising?

The pipeline says yes. Homes currently under contract are priced at about $192 per square foot, against $166 on recently closed sales — roughly 16% higher — and they average 3,566 square feet against 3,039. Pending sales are a more recent cohort than closings, so when they price well above them, it points to upward movement rather than a plateau.

Can you negotiate on price in Brecksville?

The recent closings say yes — the average sale closed at 98.9% of list, about $5,476 below asking. But that describes transactions written when there was more inventory. With eleven homes available and twenty-five under contract, the leverage those buyers had is not obviously still there.

Is Brecksville a buyer or a seller market right now?

A seller market on supply, decisively. Eleven active listings against twenty-five under contract is the tightest ratio in this report. The closing data still shows a small buyer discount, which is why this is a market worth watching closely rather than one with a settled answer.

How does Brecksville compare to Broadview Heights?

They share a border and cost exactly the same per square foot — $166 in both — but their inventory conditions are opposites. Brecksville has 11 homes for sale against 25 under contract; Broadview Heights has 30 for sale against 16. Brecksville’s higher average sale price reflects larger homes, averaging 3,039 square feet against 2,553.

How long do homes take to sell in Brecksville?

Recent closings averaged 65 days from list to contract and pending sales 67 days. Homes currently for sale have been listed only 46 days — the freshest of the three segments, which is what a market clearing its inventory looks like.

Get a Personalized Brecksville Market Analysis

Brecksville is at an inflection point that the published averages have not caught up to. Recent closings describe a market with more inventory and a small buyer discount. The twenty-five homes under contract describe something quite different.

If you are selling, I will value your home against what is actually happening now — pending activity included — rather than against closings that were negotiated under looser conditions. If you are buying, I can get you in front of new Brecksville listings immediately and tell you honestly what it will take to win one.

Contact Christopher Lotte to get started, or browse the full Brecksville, Ohio real estate market report for the underlying listing-level data.

Sources: MLS Now via the Brecksville Ohio Market Report (August 2026) · Ohio REALTORS July 2026 Housing Report · Freddie Mac Primary Mortgage Market Survey, August 20, 2026. Figures are averages for the Brecksville market area as reported by the MLS and are not a substitute for a professional valuation.

Christopher Lotte, Realtor

Sept. 1, 2026

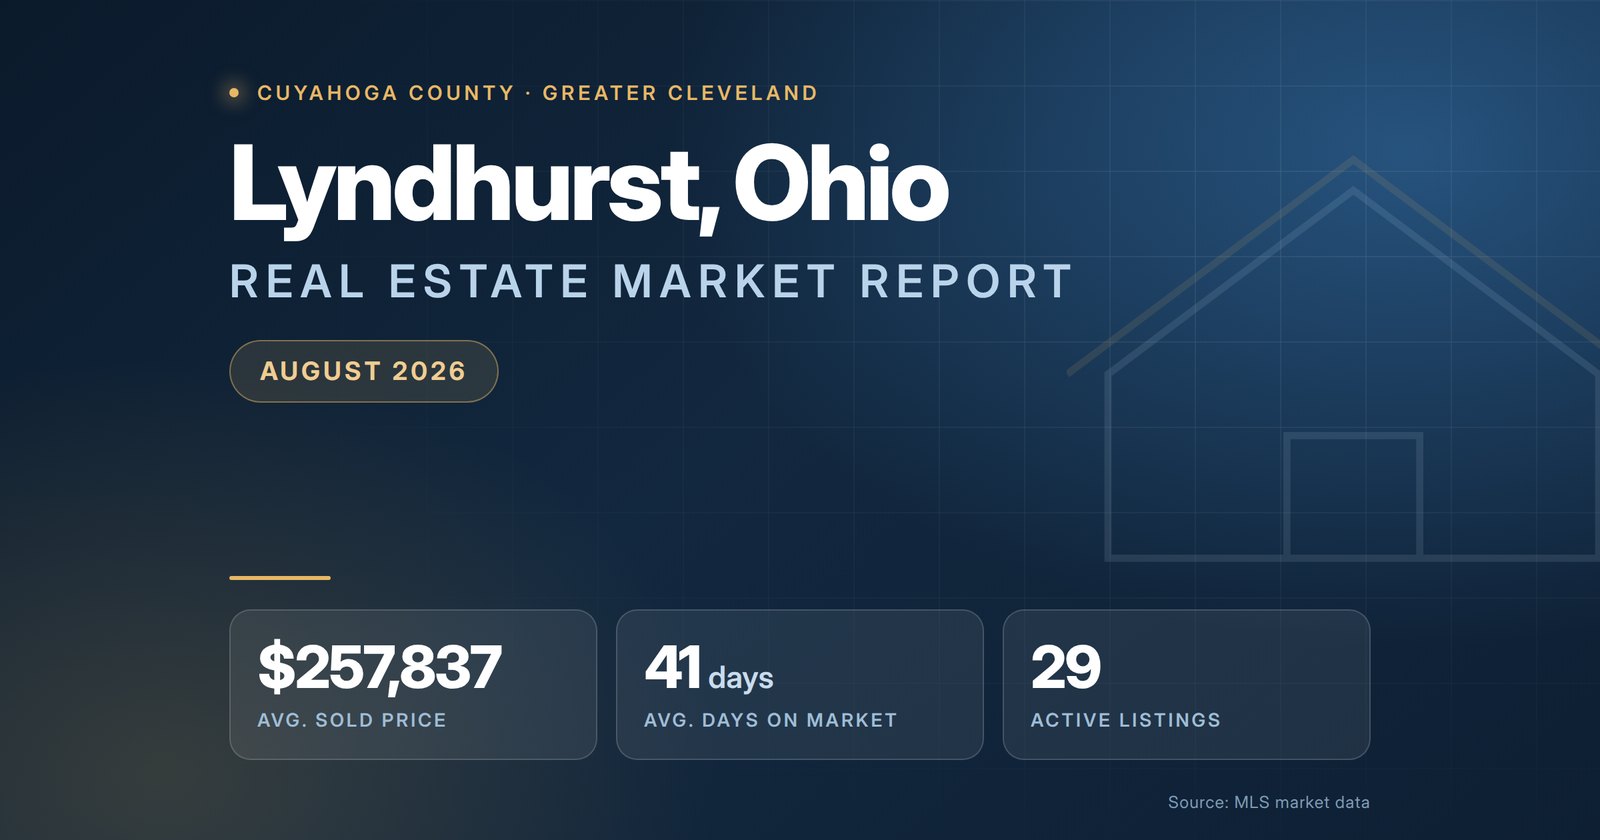
Lyndhurst Ohio Real Estate Market Report – August 2026

Lyndhurst Ohio Real Estate Market Report August 2026

Active listings in Lyndhurst are asking $133 per square foot. Recent sales closed at $133 per square foot. The same number. Across the markets covered in this series that gap usually runs somewhere between 6% and 18% — in Lyndhurst it is zero, which makes this one of the few places where the price on the sign is, statistically, the price. And what it buys is more house than the suburbs on either side: 1,994 finished square feet at an average of $257,837.

Lyndhurst Ohio Market Snapshot – August 2026

Active ListingsUnder ContractRecent ClosingsAvg Sale Price
2925110$257,837
Avg List Price (Active)Avg Price / Sq Ft (Sold)Sale-to-List RatioAvg Days on Market
$285,303$133101.2%41 (active)
Avg Beds (Sold)Avg Baths (Sold)Avg Living Area (Sold)Est. Monthly P&I
3.12.21,994 sq ft$1,324

Source: Lyndhurst, Ohio Real Estate Market Report, MLS Now data as of August 2026. Monthly payment assumes 20% down at 6.65%, principal and interest only.

A Market Where List Price Means Something

Compare the per-square-foot figure across all three segments:

  • Active listings — $133 per square foot
  • Under contract — $136 per square foot
  • Recently closed — $133 per square foot

Asking and clearing rates are identical. That is genuinely rare. In most markets a listing price tells you what a seller hopes for and you have to mentally discount it before it becomes useful. In Lyndhurst it tells you approximately what the home is worth.

The practical benefit is that screening is easier here than almost anywhere. A Lyndhurst listing meaningfully above $145 per square foot is asking for a premium the recent data does not support, and one well below $120 usually has a reason worth finding. You can shop by list price without doing arithmetic first.

It also means there is little slack in the system. A home priced 10% above the market is not opening a negotiation — it is standing out from twenty-eight other listings that are all priced correctly.

More Square Footage Than the Suburbs Beside It

This is the comparison that should move buyers. Lyndhurst and Mayfield Heights share a border:

  • Lyndhurst — 1,994 sq ft, $257,837 average sale, $133/sq ft
  • Mayfield Heights — 1,776 sq ft, $270,306 average sale, $153/sq ft

That is about 218 more square feet for roughly $12,500 less — a 13% difference in value per foot between two cities you can walk between. Both sit on the same I-271 and Mayfield Road corridor with much the same access.

The wider eastern-suburb picture puts Lyndhurst in the middle on price per foot and near the top on house size:

Lyndhurst is not the cheapest of these. It is the one where the pricing is most predictable and the homes are competitively sized for the money.

Steady, Fresh, and Absorbing

The days-on-market figures run in the healthy direction: 41 days for active listings, 46 for pendings, 50 for recent closings. Active inventory is the freshest of the three, which happens only when homes are being taken off the market roughly as fast as they arrive.

One hundred ten homes have closed recently against twenty-nine currently available — nearly four to one. Twenty-five more are under contract. Sales are landing at 101.2% of list, about $3,146 over asking.

None of those numbers is dramatic on its own. Together they describe a market that simply works: homes list at reasonable prices, sell in about seven weeks, and close slightly above asking.

Ohio Context and Mortgage Rates

Statewide, the Ohio REALTORS July 2026 report put the median Ohio sale price at $285,000, up 3.6% year over year, across 12,723 sales, with 39,641 active listings and 3.72 months of supply. Lyndhurst closes about $27,000 below that median while selling homes close to 2,000 square feet.

Freddie Mac reported the 30-year fixed averaging 6.65% and the 15-year 5.95% as of August 20, 2026, a second consecutive weekly decline. On a $206,270 loan that is roughly $1,324 a month in principal and interest.

Cuyahoga County property taxes are among the highest in Ohio and are a significant addition to that figure. Get the actual number for any specific address before budgeting from the sale price.

Lyndhurst Market Breakdown by Property Type

Featured Lyndhurst Neighborhoods

Lyndhurst is a compact, largely built-out suburb of platted allotments, and pricing shifts between them:

Acacia Court Townhomes · Acacia Estates · Acacia On Green · Acacia On The Green · Acacia Park · Alberta Park Estates · Baster Farms · Berkeley Estates · Berkeley Plaza Estates · Brainard Acres · Brainard North Cedar · Cheltenham Harwich · Corliss Drive Estates · Fairlawn Resub · Farina Resub · Frisbie Winchester Road · Henning Drive · Kilbourne Resub · Kunamaker Hlnds · Ledges Of Lyndhurst

What This Means If You Are Buying

You can trust the list prices. Asking and clearing rates match here, which makes shopping simpler than in markets where every price needs mental adjustment.

Compare per foot with Mayfield Heights before you commit. A 13% per-foot difference across a shared border is real money, and most buyers never price it.

Expect to pay at or slightly above list. The average buyer paid $3,146 over. That is the cost of a well-priced home in a market absorbing inventory this steadily.

Budget the full payment. At $1,324 in principal and interest, Cuyahoga County taxes are a large proportion of the total monthly cost. Get the real figure per address.

What This Means If You Are Selling

Your competition prices accurately. That is an advantage — buyers here take asking prices seriously, so a well-priced home gets real attention quickly — and a constraint, because an overpriced listing has nowhere to hide among twenty-eight correctly priced ones.

Price at the market and let the small premium come from competition. That is what produced the 101.2% average, and it works only if your home is in the running to begin with.

Plan on roughly seven weeks from listing to contract, and confirm Cuyahoga County point-of-sale inspection requirements for your address before you go active rather than during escrow.

How Lyndhurst Compares Nearby

  • Highland Heights — $542,553 average sale, 12 active, 10 pending, $165/sq ft
  • University Heights — $313,662 average sale, 39 active, 13 pending, $136/sq ft
  • Mayfield Heights — $270,306 average sale, 20 active, 23 pending, $153/sq ft
  • Richmond Heights — $265,823 average sale, 14 active, 12 pending, $116/sq ft
  • Lyndhurst — $257,837 average sale, 29 active, 25 pending, $133/sq ft
  • South Euclid — $214,735 average sale, 60 active, 35 pending, $113/sq ft

Richmond Heights is worth a look for anyone prioritising value per foot — at $116 it is 13% cheaper than Lyndhurst per square foot, though with only fourteen listings to choose from.

South Euclid carries the deepest inventory in the group at 60 active listings and the lowest per-foot rate, and is the natural widening of the search if Lyndhurst’s twenty-nine listings do not include what you want.

Frequently Asked Questions

What is the average home price in Lyndhurst, Ohio?

Recent closed sales in the Lyndhurst market area averaged $257,837, or about $133 per square foot on an average of 1,994 finished square feet. That is roughly $27,000 below the Ohio statewide median — on homes that are larger than most of the surrounding eastern suburbs sell.

How much is the monthly payment on an average Lyndhurst home?

At the $257,837 average closing price with 20% down and the Freddie Mac 30-year average of 6.65% as of August 20, 2026, principal and interest come to roughly $1,324 per month on a $206,270 loan. Cuyahoga County property taxes and homeowners insurance are additional and are substantial.

Are asking prices in Lyndhurst realistic?

Exactly realistic, on the evidence. Active listings are asking $133 per square foot and recent sales closed at $133 per square foot — the same figure. Pending sales sit at $136. Across most markets in this series the gap between asking and clearing rates runs 6 to 18%. In Lyndhurst there is essentially none.

Are homes in Lyndhurst selling above asking price?

Slightly. The average sale closed at 101.2% of list — about $3,146 over asking, on an average list price of $254,691.

Is Lyndhurst a buyer or a seller market right now?

Close to balanced, tilted mildly toward sellers by the closing data. There are 29 active listings against 25 under contract — a ratio of 1.16 — with 110 recent closings and sales landing just above asking.

Does Lyndhurst offer more house for the money than Mayfield Heights?

Measurably, yes. Lyndhurst sales averaged 1,994 finished square feet at $257,837; Mayfield Heights next door averaged 1,776 square feet at $270,306. That is about 218 more square feet for roughly $12,500 less — a 13% difference in price per square foot ($133 against $153) between two bordering cities.

How long do homes take to sell in Lyndhurst?

Recent closings averaged 50 days from list to contract, pending sales 46 days, and homes currently for sale have been listed 41 days. The active inventory being the freshest of the three means homes are being absorbed rather than accumulating.

Is Lyndhurst a good place to buy right now?

For a buyer who wants square footage in eastern Cuyahoga County at a moderate price, the case is strong: about $1,324 a month in principal and interest for a home averaging just under 2,000 square feet, in a market where asking prices track actual sale prices closely enough that you can shop by list price. Verify Cuyahoga County taxes and any point-of-sale inspection requirements before budgeting.

Get a Personalized Lyndhurst Market Analysis

Lyndhurst is unusually legible as markets go — asking prices track sale prices, the pace is steady, and there is no distorted inventory to read around. That makes the remaining variables the ones that matter: your specific street, your home’s condition, and how it stacks up against the twenty-eight others competing with it.

If you are selling, I will price your home where the market has actually been clearing and tell you honestly how it compares to the current competition. If you are buying, I can run the per-foot comparison across the whole eastern corridor with you, so you know what your money buys in each city rather than guessing.

Contact Christopher Lotte to get started, or browse the full Lyndhurst, Ohio real estate market report for the underlying listing-level data.

Sources: MLS Now via the Lyndhurst Ohio Market Report (August 2026) · Ohio REALTORS July 2026 Housing Report · Freddie Mac Primary Mortgage Market Survey, August 20, 2026. Figures are averages for the Lyndhurst market area as reported by the MLS and are not a substitute for a professional valuation.

Christopher Lotte, Realtor

Sept. 1, 2026

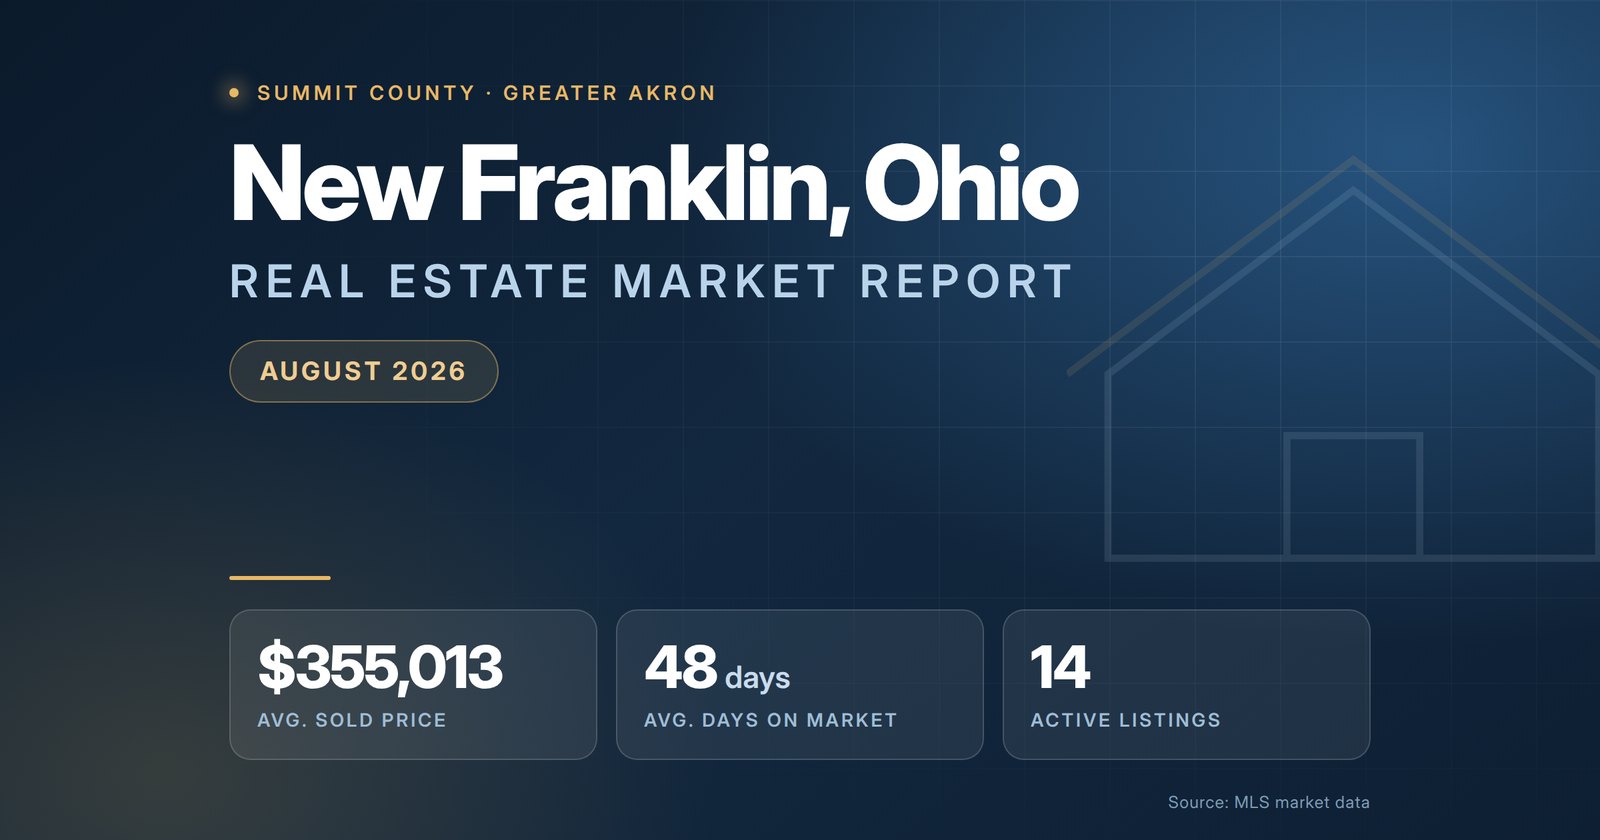
New Franklin Ohio Real Estate Market Report – August 2026

New Franklin Ohio Real Estate Market Report August 2026

The average home listed in New Franklin asks $655,107. The median asks $295,000. Two lakefront properties — one at $4,495,000 — account for essentially the entire difference. This is the Portage Lakes effect, and it makes New Franklin one of the markets in Ohio where reading the average instead of the median will send you badly wrong. What actually sold here recently: 36 homes at $355,013, about $6,645 below asking.

New Franklin Ohio Market Snapshot – August 2026

Active ListingsUnder ContractRecent ClosingsAvg Sale Price
141236$355,013
Avg List Price (Active)Median List (Active)Avg Price / Sq Ft (Sold)Sale-to-List Ratio
$655,107$295,000$16198.2%
Avg Beds (Sold)Avg Baths (Sold)Avg Living Area (Sold)Est. Monthly P&I
3.32.42,293 sq ft$1,823

Source: New Franklin, Ohio Real Estate Market Report, MLS Now data as of August 2026. Median calculated from the individual active listings. Active, pending, and sold segments all averaged 49 days on market. Monthly payment assumes 20% down at 6.65%, principal and interest only.

The Portage Lakes Split

New Franklin is really two housing markets that share a municipal boundary. Here is how the fifteen individual active listings distribute:

  • The least expensive asks $179,900
  • The median asks $295,000
  • Two ask more than $1,000,000
  • The highest asks $4,495,000

Two properties out of fifteen are producing an average more than twice the median. That is not a data error — New Franklin contains a substantial portion of the Portage Lakes, and waterfront property there trades at prices unrelated to the rest of the city.

The consequence is that any citywide statistic for New Franklin needs to be handled carefully. An automated valuation trained on the average asking price would badly overvalue an off-water home; one trained on the median would badly undervalue a lakefront one. The two segments do not inform each other.

The closed data is the more useful anchor because waterfront sales are rare enough not to dominate it: 36 recent closings averaging $355,013 at $161 per square foot.

Forty-Nine Days, Across the Board

One number in this month’s data is striking for its consistency. Active listings have been on market an average of 49 days. Pending sales averaged 49 days to reach a contract. Recent closings averaged 49 days.

Three separate populations, the same figure. That is unusual and it says something useful: New Franklin has no backlog of stale inventory, and the pace has not shifted between what already sold and what is still listed. When active days-on-market runs well ahead of sold days-on-market, it means the market has been rejecting the available inventory. Here it has not.

Fourteen homes are available against twelve under contract — a ratio of 1.17. Modest selection, steady absorption, no accumulation.

Buyers Are Getting About 2% Off

The average New Franklin sale closed at 98.2% of list — roughly $6,645 below asking, on an average list price of $361,658.

Discounts of that size are more common in upper-price markets than in entry-level ones, for a structural reason: the higher the price, the smaller the pool of buyers who can transact, and the more negotiating leverage each individual buyer holds. With a meaningful share of New Franklin’s inventory sitting well above the county median, that dynamic applies here.

For a buyer, an offer below asking is a normal opening position in this market. For a seller, the last few percent of an ambitious list price is unlikely to survive to closing.

Priced With Its Neighbors, Not Above Them

On the measure that strips out house size, New Franklin sits right alongside the southern Summit County communities:

  • Green — $379,611 sale, $164/sq ft
  • Norton — $308,556 sale, $163/sq ft
  • New Franklin — $355,013 sale, $161/sq ft
  • Clinton — $330,963 sale, $153/sq ft
  • Barberton — $194,145 sale, $132/sq ft
  • Akron — $198,244 sale, $121/sq ft

New Franklin, Green, and Norton are within three dollars per square foot of one another. The differences in their average sale prices are differences in house size, not in what a square foot is worth. Barberton, immediately north, is where the per-foot rate genuinely drops — about 18% below New Franklin.

Ohio Context and Mortgage Rates

Statewide, the Ohio REALTORS July 2026 report put the median Ohio sale price at $285,000, up 3.6% year over year, across 12,723 sales, with 39,641 active listings and 3.72 months of supply. New Franklin closes about $70,000 above that median.

Freddie Mac reported the 30-year fixed averaging 6.65% and the 15-year 5.95% as of August 20, 2026, a second consecutive weekly decline. On a $284,010 loan that is roughly $1,823 a month in principal and interest.

Waterfront and near-water properties carry insurance and maintenance considerations that off-water homes do not. If you are shopping the Portage Lakes specifically, price those in before you price the house.

New Franklin Market Breakdown by Property Type

What This Means If You Are Buying

Decide first whether you are shopping the water. The lakefront market and the off-water market here have almost nothing to do with each other. Searching the city as a whole produces statistics that describe neither.

Off the water, the median is $295,000. That is the number to plan around, not the $655,107 average.

Negotiate. The average buyer got 1.8% off. That is normal practice in this market.

On the water, budget beyond the purchase price. Insurance, dock and seawall maintenance, and the specific water access rights attached to a parcel all matter, and none of them appear in a price-per-square-foot figure.

What This Means If You Are Selling

Price to your segment. A lakefront property and an off-water home in New Franklin have separate comparable sales, separate buyer pools, and separate timelines. A citywide average serves neither.

Off the water, the market is steady and predictable — 49 days to contract, closing about 2% under asking, with only a handful of competing listings. Price accurately and it should move on schedule.

On the water, understand that the buyer pool is small and the properties currently listed above $1 million represent your real competition. Pricing to the handful of genuine comparables matters far more than any market-wide statistic.

How New Franklin Compares Nearby

  • Green — $379,611 average sale, 24 active, 18 pending, $164/sq ft
  • New Franklin — $355,013 average sale, 14 active, 12 pending, $161/sq ft
  • Clinton — $330,963 average sale, 12 active, 9 pending, $153/sq ft
  • Norton — $308,556 average sale, 8 active, 18 pending, $163/sq ft
  • Akron — $198,244 average sale, 556 active, 306 pending, $121/sq ft
  • Barberton — $194,145 average sale, 35 active, 40 pending, $132/sq ft

Norton is worth noting for its supply picture — just 8 active listings against 18 under contract, far tighter than New Franklin at nearly identical per-foot pricing. A buyer who wants this price band and this part of Summit County will find more to look at in New Franklin and more competition in Norton.

Green is the closest peer overall, at 2% more per square foot with somewhat larger homes and more inventory.

Frequently Asked Questions

What is the average home price in New Franklin, Ohio?

Recent closed sales in the New Franklin market area averaged $355,013, or about $161 per square foot on an average of 2,293 finished square feet. That is roughly $70,000 above the Ohio statewide median of $285,000.

Why is the average listing price over $650,000 when homes sell for $355,000?

Because of the lakefront. New Franklin includes the Portage Lakes, and two of the fifteen homes currently listed are priced above $1 million — one at $4,495,000. Those two pull the average asking price to $655,107. The median active listing asks about $295,000, which is a far better description of the market most buyers are shopping.

How much is the monthly payment on an average New Franklin home?

At the $355,013 average closing price with 20% down and the Freddie Mac 30-year average of 6.65% as of August 20, 2026, principal and interest come to roughly $1,823 per month on a $284,010 loan. At the median active list price of about $295,000, the same assumptions produce roughly $1,515. Summit County property taxes and homeowners insurance are additional.

Can you negotiate on price in New Franklin?

Yes. The average sale closed at 98.2% of list — about $6,645 below asking. With 14 active listings against 12 under contract and a small buyer pool at the upper end, there is genuine room here.

Is New Franklin a buyer or a seller market right now?

It leans slightly toward buyers. The active-to-pending ratio is 1.17 and sales are closing about 2% under asking. The inventory is small in absolute terms, but a meaningful share of it sits at price points with very few possible buyers.

How long do homes take to sell in New Franklin?

Unusually consistently: 49 days on average across all three segments — active listings, pending sales, and recent closings alike. That uniformity indicates a market with no backlog of stale inventory and no meaningful change in pace between what sold and what is still listed.

What is the Portage Lakes housing market like?

It is the reason New Franklin’s statistics look the way they do. Waterfront and near-water properties on the Portage Lakes trade at prices far above the rest of the city, and they represent a small number of transactions relative to the inventory they occupy. If you are shopping off-water New Franklin, the median listing near $295,000 is your market, not the $655,107 average.

How does New Franklin compare to Green and Norton?

On price per square foot the three are close — $161 in New Franklin, $164 in Green, $163 in Norton. New Franklin’s lower average sale price than Green ($355,013 against $379,611) is a size difference, not a value difference. Barberton, immediately north, is the affordability step down at $132 per square foot.

Get a Personalized New Franklin Market Analysis

New Franklin is the clearest example in Summit County of a market where the published average is not a valuation. A $4.5 million lakefront listing and a $180,000 off-water house are averaged together into a number that describes neither, and automated estimates inherit that problem directly.

If you are selling, I will value your home against the properties that genuinely compete with it — on the water or off it — and give you a realistic timeline for that specific segment. If you are buying, I can separate this market into the part you are actually shopping and tell you where the negotiating room sits.

Contact Christopher Lotte to get started, or browse the full New Franklin, Ohio real estate market report for the underlying listing-level data.

Sources: MLS Now via the New Franklin Ohio Market Report (August 2026) · Ohio REALTORS July 2026 Housing Report · Freddie Mac Primary Mortgage Market Survey, August 20, 2026. Averages are as reported by the MLS; the median active list price and price-band counts were calculated from the individual listings shown on the market report page. Not a substitute for a professional valuation.

Christopher Lotte, Realtor

Sept. 1, 2026

Foreclosure vs. Short Sale vs. Deed in Lieu: Which Hurts Your Credit Least?

Illustration comparing three routes out of a distressed Ohio mortgage — foreclosure, short sale and deed in lieu — as diverging paths on a chart

On credit alone, a short sale and a deed in lieu are generally less damaging than a foreclosure, and a completed foreclosure is the worst of the three. But that ranking is the least useful thing on this page. The gap is narrower than most people expect, and it is not what decides how much money you walk away owing. Two things separate these routes in thousands of dollars: whether the lender waives the remaining debt in writing, and what the tax code does with the debt that gets waived.

All three end the same way — you no longer own the house. What differs is how much control you keep, what happens to the shortfall, and how long each takes. And there is a fourth option this comparison usually leaves out: if you still have equity, an ordinary sale beats all three outright.

Need to sell an Ohio house fast? Text “Cash Offer” to (614) 858-8384

Before you pick between three bad options, it is worth finding out whether you are actually underwater — plenty of people negotiate short sales they never needed. No obligation, no fee, and we will tell you honestly if listing would net you more. Get a cash offer on your Ohio home.

Foreclosure: What You Give Up

In Ohio the court orders the property sold, through the sheriff or a private selling officer. You control nothing about it — not price, not timing, not who buys it. From filing to sale most Ohio cases run several months to well over a year, driven mainly by how backed up the county's docket is.

You pay nothing out of pocket, which is the only thing foreclosure has going for it, and in exchange arrears, default interest, court costs and legal fees accumulate against the property the whole time. If there was equity when the case was filed, that is where it goes. On credit it is the most severe of the three, and the one route where no part of the outcome is negotiated by you.

Short Sale: Control, If the Approval Letter Cooperates

You sell for less than the balance owed and the lender agrees to release its lien so the sale can close. You keep meaningful control — you choose the buyer and negotiate the terms — but every material term is subject to lender approval, and that review is slow. Expect months, not weeks.

The approval letter is the entire transaction. Some waive the shortfall outright; some expressly reserve the lender's right to pursue it later. A short sale closed under a letter that reserved the deficiency leaves you owing money you were certain had disappeared, and the closing table is far too late to find out which kind you have. Have an Ohio attorney read it before you sign. Cost is usually nothing out of pocket, because commissions and customary closing costs come out of the lender's proceeds.

The practical difficulty is buyer patience. A retail buyer with a lease expiring walks by about week four, while a buyer who has closed short sales before will stay under contract through a lender review that keeps slipping — which is why cash buyers turn up so often in these files.

Deed in Lieu: The Fastest Exit, and the One Lenders Refuse Most

You convey the property back to the lender voluntarily and the lender accepts it in satisfaction of the loan. When a lender agrees, this is by a wide margin the fastest of the three: no marketing period, no buyer, no auction.

It happens less often than people expect because of junior liens. Taking the deed means taking the property subject to whatever else is recorded against it — a second mortgage, a judgment lien, a contractor's lien. Foreclosure extinguishes those; a deed in lieu does not, so a lender looking at a second mortgage will often decline and foreclose instead. On credit it sits close to a short sale, sometimes marginally better. You walk away with nothing, which is why it only makes sense when there is nothing to walk away with.

Credit: Why the Gap Is Smaller Than You Expect

The honest position: a short sale or a deed in lieu is generally treated less harshly than a completed foreclosure, and both usually shorten the wait before a lender will consider you for a new mortgage.

What nobody can responsibly give you is a number. There is no reliable published figure for how many points an Ohio homeowner loses to a foreclosure versus a short sale, and any article quoting one is inventing it — the effect depends on where your score started, how many other accounts are delinquent, and how thin the rest of the file is. Waiting periods before you can buy again are similarly program-specific, and extenuating-circumstances rules can shorten them; ask a lender to run your actual file rather than a general table.

The reason this matters is that people optimize the wrong variable. They accept a deficiency-reserving short sale to protect a score difference they cannot quantify, and then get sued for the shortfall two years later.

The Reporting Clock Does Not Restart, Whichever Route You Take

One thing genuinely does not differ: how long the episode stays on your credit report. Under 15 U.S.C. 1681c the seven-year period runs from the delinquency that preceded the collection or charge-off, not from the date the house changed hands. A short sale closing in month eight rather than a foreclosure concluding in month twenty does not reset that clock — the anchor is the same original delinquency. That rule, and how to read the dates on your own report, is the subject of the next post in this series.

Deficiency: The Variable That Actually Separates Them

A deficiency is the balance left over after the house is gone. This is where the real money sits, and the Ohio rule has a qualifier that gets dropped constantly.

ORC 2329.08 makes a money judgment unenforceable as to any remaining deficiency two years after the court confirms the judicial sale — but only for property with a dwelling for not more than two families, used in whole or in part as a home or farm dwelling, and held as a homestead or homesite by the person who gave or assumed the mortgage. A triplex, a small apartment building or a house you never lived in does not get that cutoff, and the clock runs from confirmation of the sale, not the filing. It is a real protection with real edges, not a blanket rule for all residential property.

Two Ohio auction rules affect the size of the shortfall as well. Under ORC 2329.20 property generally may not sell below two-thirds of its appraised value at the first auction, which puts a floor under the credit against your balance. But under ORC 2329.52(B), if it does not sell there, a second auction is held without a minimum bid — and a lower price means a larger deficiency. In a short sale or deed in lieu you can negotiate that exposure away in advance; in a foreclosure you cannot.

The 2026 Tax Change That Rewrote This Comparison

For years, forgiven mortgage debt on a main home could be excluded from taxable income under the qualified principal residence indebtedness rules. That exclusion now reaches only debt discharged before January 1, 2026, or discharged under a written arrangement entered into before that date (IRS Topic 431). As of August 2026 it has not been extended, though Congress has extended it before and may again.

So a waived deficiency in 2026 is generally cancellation-of-debt income, reported on a Form 1099-C and generally taxable. That cuts against the instinct to chase a waiver at any cost, and it applies to all three routes: a short sale waiver, a deed in lieu accepted in full satisfaction, and a written-off foreclosure deficiency are all discharges. The exclusion most distressed sellers now rely on is insolvency — if your liabilities exceeded your assets immediately before the discharge, the forgiven amount is excluded to that extent. It is permanent, fact-specific, and needs a CPA and a balance sheet rather than a rule of thumb. Get that advice before you sign an approval letter, not in April.

Before You Choose Any of the Three: Do You Have Equity?

Most articles rank these options on credit impact. That is the wrong lead variable: the credit differences are small and unquantifiable, while the deficiency and tax differences are large and knowable.

The first question is whether you are actually underwater. Get a current valuation before assuming so. Values move, and people arrive at short sale conversations who never needed one — if there is equity, even a little, you sell normally, pay the loan in full, keep the difference and take no credit damage at all.

If you are genuinely underwater, the question becomes which route gets you a written deficiency waiver fastest, with the tax consequence understood before you sign. That is usually a short sale, sometimes a deed in lieu, and almost never a foreclosure. All three also get harder the longer you wait — once a sale date is set, short sales and deeds in lieu are very difficult to complete in time. The month you start the conversation matters more than which option you choose.

Frequently Asked Questions

Is a short sale better for your credit than a foreclosure?

Generally yes, and it often shortens the wait before a lender will consider a new mortgage. But the gap is smaller than most people assume and no reliable published figure states it in points, because the effect depends on the rest of your file. The deficiency terms usually matter more in dollars than the credit difference does.

Can a lender still sue me after a short sale in Ohio?

Yes, unless the written approval letter waives the deficiency. Some approvals expressly reserve the lender's right to pursue the shortfall. Never rely on a verbal assurance, and have an Ohio attorney read the letter before closing, because after closing the terms of that letter are what govern.

Why would a lender refuse a deed in lieu?

Usually because of junior liens. Accepting the deed means accepting the property subject to a second mortgage, judgment lien or contractor's lien, whereas foreclosure extinguishes junior liens. Lenders facing anything else recorded against the title will commonly decline the deed and foreclose instead.

Will I owe tax on forgiven mortgage debt in 2026?

Possibly. The qualified principal residence indebtedness exclusion applies to debt discharged before January 1, 2026, or under a written arrangement entered into before then (IRS Topic 431), and has not been extended as of August 2026. Forgiven debt is otherwise generally taxable, though the permanent insolvency exclusion may apply. Ask a CPA.

How long before I can buy a house again?

It varies by loan program and by whether extenuating circumstances applied. Short sales and deeds in lieu typically carry shorter waiting periods than a completed foreclosure, but the tables change and the exceptions are meaningful. Ask a lender to look at your specific situation rather than relying on a general figure from an article.

Related Reading

This article is general information about Ohio real estate and is not legal, tax, or financial advice. Foreclosure, probate, bankruptcy and title matters are fact-specific — consult a licensed Ohio attorney or CPA about your situation. We are a licensed Ohio real estate brokerage, not a law firm.

Aug. 31, 2026

Beachwood Ohio Real Estate Market Report – August 2026

Beachwood Ohio Real Estate Market Report August 2026

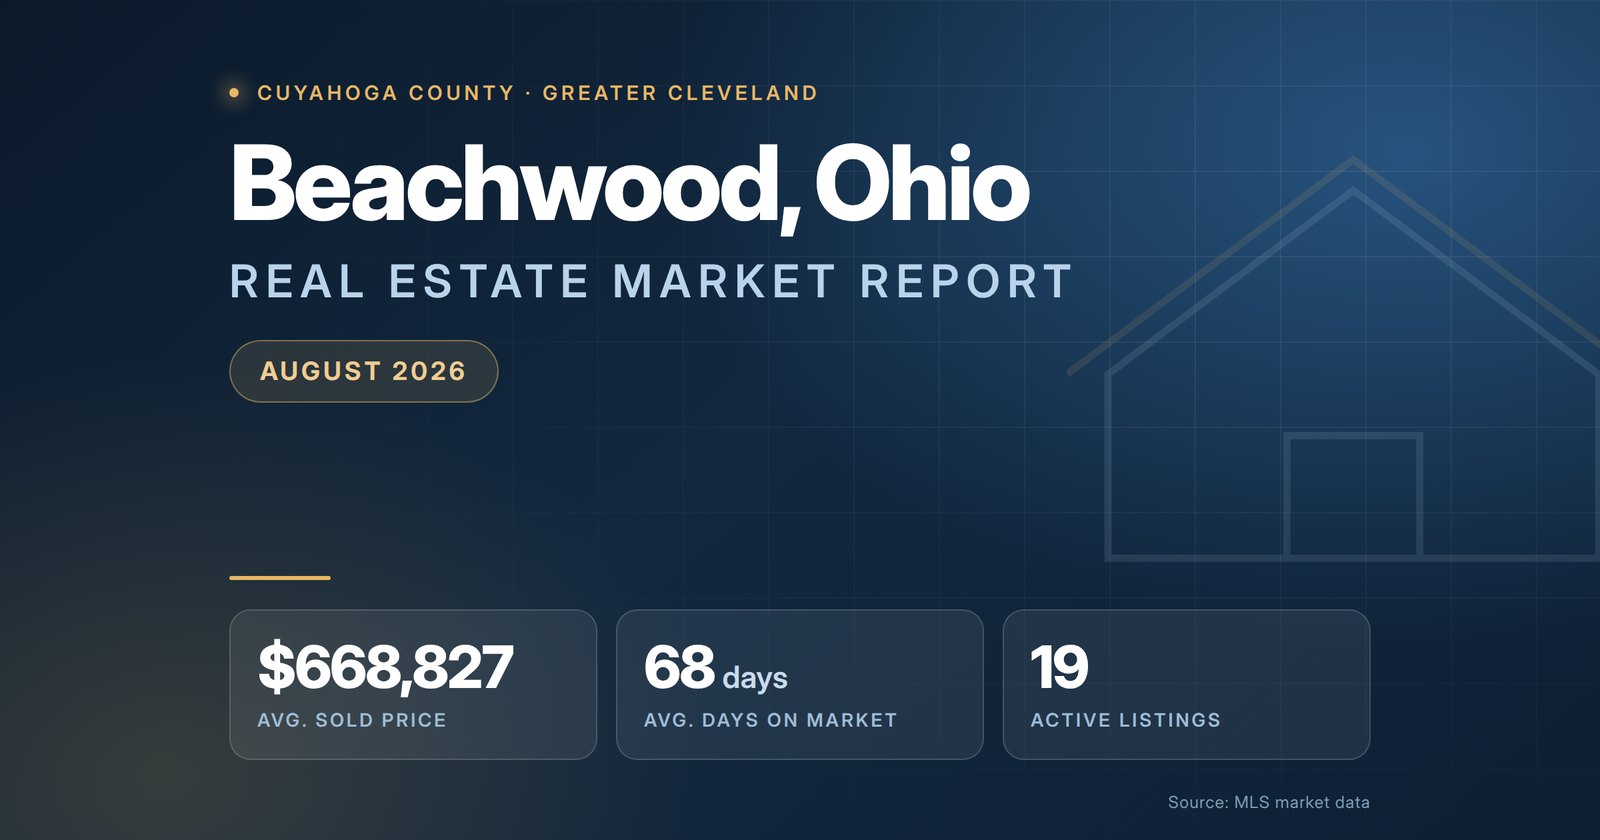
Beachwood is where the upper end of Cleveland’s east side actually trades. 55 homes have closed recently at an average of $668,827 on 3,416 finished square feet — against 31 closings in Pepper Pike, 17 in Moreland Hills, and 12 in Orange. And they closed at 100.2% of asking: $668,827 against an average list price of $667,732, a gap of $1,095. On a two-thirds-of-a-million-dollar average, that is a market landing squarely on its number.

Beachwood Ohio Market Snapshot – August 2026

Active ListingsUnder ContractRecent ClosingsAvg Sale Price
191255$668,827
Avg List Price (Sold)Avg Price / Sq Ft (Sold)Sale-to-List RatioAvg Days on Market
$667,732$193100.2%68 (sold)
Avg Beds (Sold)Avg Baths (Sold)Avg Living Area (Sold)Est. Monthly P&I
3.73.63,416 sq ft$3,435

Source: Beachwood, Ohio Real Estate Market Report, MLS Now data as of August 2026. Monthly payment assumes 20% down at 6.65%, principal and interest only.

Landing on the Number

A 100.2% sale-to-list ratio across 55 transactions at this price point is a meaningful result. It means neither side is systematically winning: sellers are not discounting to move inventory, and buyers are not being forced to bid up.

That is more common in upper-tier markets than in entry-level ones, and for a structural reason. The higher the price, the smaller the pool of buyers who can transact, and the less likely any given home draws two of them at once. Competitive bidding gets rarer; careful, well-informed pricing matters more.

The practical translation is that in Beachwood, list price is genuinely informative. It is not a hopeful number to be discounted, and it is not a floor to bid up from. Both sides can plan around it — which makes this an easier market to transact in than most at this price.

Where the East Side Actually Transacts

Set the upper-tier eastern suburbs side by side on volume:

  • Beachwood55 recent closings, $668,827 average, $193/sq ft
  • Pepper Pike — 31 closings, $1,009,258 average, $209/sq ft
  • Moreland Hills — 17 closings, $864,205 average, $219/sq ft
  • Orange — 12 closings, $756,700 average, $182/sq ft

Beachwood produces more closings than the other three combined. It is priced below Pepper Pike and Moreland Hills per square foot while selling homes of comparable scale, and it carries more inventory than any of them.

That matters practically. In a market with 12 or 17 annual-scale transactions, comparable sales are thin and valuations rest on very few data points. Beachwood has enough volume that a valuation here can be grounded in real evidence — and enough that a seller has a realistic expectation of finding a buyer within a defined timeframe.

The Pipeline Is a Tier Below the Closings

One number in this month’s data deserves attention. The homes that recently closed averaged 3,416 finished square feet at $667,732. The homes currently under contract average 2,377 square feet at $476,400.

That is more than a thousand square feet and nearly $200,000 of difference between what just sold and what is about to. Beachwood has a substantial condominium and attached-housing segment alongside its large single-family stock, and the current pipeline is weighted toward it.

Twelve pending sales is a small sample, so this is a signal rather than a conclusion. But read alongside the 1.58 active-to-pending ratio — 19 available against 12 committed — it suggests the mid-tier of this market is moving more readily right now than the largest homes are.

For a seller at the top of the Beachwood market, that argues for realistic pricing and a longer expected timeline. For a buyer at that level, it means more leverage than the citywide 100.2% figure would suggest.

Ohio Context and Mortgage Rates

Statewide, the Ohio REALTORS July 2026 report put the median Ohio sale price at $285,000, up 3.6% year over year, across 12,723 sales, with 39,641 active listings and 3.72 months of supply. Beachwood closes at roughly 2.3 times the statewide median.

Freddie Mac reported the 30-year fixed averaging 6.65% and the 15-year 5.95% as of August 20, 2026, a second consecutive weekly decline. On a $535,062 loan that is roughly $3,435 a month in principal and interest, and the move from 7.00% to 6.65% is worth about $126 a month — rate movements carry real dollar weight at this loan size.

Cuyahoga County property taxes on a $668,000 home are a substantial addition to that figure. Get the actual number for any specific address rather than estimating from the sale price.

Beachwood Market Breakdown by Property Type

With a meaningful condominium segment alongside the single-family stock, browsing by type is genuinely useful here:

Featured Beachwood Neighborhoods

Beachwood is built out of distinct subdivisions and condominium developments, and pricing varies substantially between them:

Baywood Estates Condos · Beachmont Estates Resub · Beachwood Park Estates · Bernwood Road · Brainardwood Estate · Community Gardens · Cranberry Courts · Fairmount Courts · Fairmount Greens · Fairmount Hendon · Fairmount Park Estates · Fairmount Richmond · Fairwood Glen · Halburton Resub · Hilltop Drive · Kangesser Fairmont Greens · Point East Condos · Rapid Transit · Rtldco Resub · Shaker Country Estates

What This Means If You Are Buying

Take list price seriously. At 100.2% of asking across 55 sales, Beachwood prices are informative rather than aspirational. That makes screening easier than in markets where everything must be mentally discounted.

At the top of the market, you have more room than the average shows. The pipeline is currently weighted toward smaller homes. If you are shopping the largest single-family properties, the buyer pool is thin and your position is stronger than the citywide figure implies.

Decide between single-family and condominium early. These are effectively two markets with different pricing, different competition, and different carrying costs. Association fees at this price point vary widely and change the monthly picture materially.

Compare the corridor honestly. Shaker Heights and University Heights are roughly 30% cheaper per square foot in the same part of the county, on smaller homes and in different school districts. Whether that trade works depends entirely on your priorities — but it is worth pricing.

What This Means If You Are Selling

The market is paying essentially list price. That is good news and a discipline at the same time: price correctly and you should get your number, but there is no competitive dynamic here to rescue an aggressive one.

If your home is in the largest tier, plan for a longer runway than the 68-day average. Nineteen active listings against twelve pending, with the pipeline concentrated below your price point, means fewer buyers cycling through your segment.

Presentation and accurate pricing carry the weight here. Confirm Cuyahoga County point-of-sale inspection requirements for your address before listing rather than during escrow.

How Beachwood Compares Nearby

  • Pepper Pike — $1,009,258 average sale, 10 active, 7 pending, $209/sq ft
  • Moreland Hills — $864,205 average sale, 7 active, 6 pending, $219/sq ft
  • Orange — $756,700 average sale, 5 active, 4 pending, $182/sq ft
  • Beachwood — $668,827 average sale, 19 active, 12 pending, $193/sq ft
  • Highland Heights — $542,553 average sale, 12 active, 10 pending, $165/sq ft
  • Shaker Heights — $365,734 average sale, 82 active, 21 pending, $138/sq ft
  • University Heights — $313,662 average sale, 39 active, 13 pending, $136/sq ft

Highland Heights is the value comparison within the upper tier: 15% less per square foot than Beachwood on homes of similar scale, averaging 3,405 square feet against Beachwood’s 3,416. For a buyer whose priority is a large house rather than the Beachwood address and school district, that is a substantial saving on nearly identical square footage.

Shaker Heights is the sharpest contrast in the corridor — 82 active listings against Beachwood’s 19, at 29% less per square foot on distinctly different housing stock.

Frequently Asked Questions

What is the average home price in Beachwood, Ohio?

Recent closed sales in the Beachwood market area averaged $668,827, or about $193 per square foot on an average of 3,416 finished square feet. That is roughly $384,000 above the Ohio statewide median, and the homes are large — among the biggest average sale sizes in this series.

How much is the monthly payment on an average Beachwood home?

At the $668,827 average closing price with 20% down and the Freddie Mac 30-year average of 6.65% as of August 20, 2026, principal and interest come to roughly $3,435 per month on a $535,062 loan. Cuyahoga County property taxes and homeowners insurance are additional and are substantial at this price level.

Do homes in Beachwood sell for asking price?

Almost exactly. The average sale closed at 100.2% of list — $668,827 against an average list price of $667,732, a difference of just $1,095. Across 55 transactions, that is about as close to par as a market gets.

Is Beachwood a buyer or a seller market right now?

It is close to balanced with a mild buyer tilt on selection. There are 19 active listings against 12 under contract — a ratio of 1.58 — and sales are landing essentially at asking price rather than above it. At this price point the buyer pool is naturally smaller, which limits how much pressure sellers can generate.

Why are the homes under contract smaller than the ones that sold?

Recent closings averaged 3,416 finished square feet, while the homes currently under contract average 2,377 — more than a thousand square feet less — at an average asking price of $476,400 against $667,732. Buyers are currently absorbing the mid-tier of this market, including its condominium and attached inventory, while the largest single-family homes wait longer for their buyer.

How does Beachwood compare to Pepper Pike and Shaker Heights?

Beachwood sits in the middle of the eastern suburbs on price per square foot: $193, against $219 in Moreland Hills, $209 in Pepper Pike, $182 in Orange, and $138 in Shaker Heights. What distinguishes it is volume — 55 recent closings against 31 in Pepper Pike, 17 in Moreland Hills, and 12 in Orange. It is where the upper end of the east side actually transacts.

How long do homes take to sell in Beachwood?

Recent closings averaged 68 days from list to contract, pending sales 71 days, and active listings have been out 57 days. Plan on roughly two to two and a half months, with the largest homes typically taking longer than the average suggests.

Is Beachwood a good value at $193 per square foot?

Relative to its immediate peers, it is priced below Pepper Pike and Moreland Hills while selling homes of similar scale, and it offers considerably more inventory and transaction volume than either. Whether it is a good value depends on what you need — Shaker Heights and University Heights are roughly 30% cheaper per foot in the same corridor, on smaller homes and in different school districts.

Get a Personalized Beachwood Market Analysis

Beachwood contains at least two markets — large single-family homes and a substantial condominium segment — and they are behaving differently right now. A citywide average of $668,827 does not describe either one precisely.

If you are selling, I will value your home against the properties that genuinely compete with it and give you a realistic timeline for your specific tier rather than the citywide figure. If you are buying, I can tell you where the leverage actually is in this market — and it is not evenly distributed across price points.

Contact Christopher Lotte to get started, or browse the full Beachwood, Ohio real estate market report for the underlying listing-level data.

Sources: MLS Now via the Beachwood Ohio Market Report (August 2026) · Ohio REALTORS July 2026 Housing Report · Freddie Mac Primary Mortgage Market Survey, August 20, 2026. Figures are averages for the Beachwood market area as reported by the MLS and are not a substitute for a professional valuation.

Christopher Lotte, Realtor

Aug. 31, 2026

Christopher Lotte Returns to eXp Realty to Launch New Agent Growth and Lead Referral Initiative

Christopher Lotte - Realtor® - eXp Realty

Christopher Lotte Returns to eXp Realty to Launch New Agent Growth and Lead Referral Initiative

Central Ohio real estate veteran combines large-scale internet lead generation with advanced lead conversion, coaching, training and collaboration with successful eXp Realty leaders

COLUMBUS, OHIO — August 31, 2026 — Central Ohio real estate professional, digital marketing specialist and new home construction expert Christopher Lotte has officially returned to eXp Realty, marking the beginning of a new chapter focused not only on serving buyers and sellers, but also on building a powerful ecosystem of lead generation, conversion, coaching and training resources for real estate agents.

For Lotte, the move represents much more than simply changing brokerages.

After previously being affiliated with eXp Realty, Lotte is returning with a very different strategy — one centered around collaboration with successful agents and coaches, combining their respective strengths, and creating systems that can help other real estate professionals build more productive and sustainable businesses.

Among the professionals Lotte is now directly aligned with at eXp are Jon Harp, Tristan Horn, Alan Kushmakov and Joshua Smith, each connected to his organization through eXp’s sponsorship structure and each bringing a different area of expertise to the relationship — from local leadership and accountability to internet lead conversion, business development and agent coaching. At the same time, eXp’s strong collaborative environment gives Lotte the opportunity to work alongside and learn from other experienced professionals throughout the company, including longtime Central Ohio real estate professional Jim Lambright, as well as former agents from Lotte’s own team who later moved to eXp and have continued to flourish, including Barnabas Boehler, Krista Johnson and Rachael Gruenbaum.

“The biggest reason I came back to eXp is the people and the opportunity to collaborate,” Lotte said. “I’m surrounding myself with people who are exceptional at different parts of this business. Instead of trying to reinvent everything myself, I can combine what I do best with systems, coaching and expertise that other successful agents and entrepreneurs have already built.”

The result, Lotte believes, can become something much larger than the resources available from any one individual.

A Different Approach to Returning to eXp Realty

Lotte has spent years developing an extensive online real estate marketing infrastructure, specializing in search engine optimization, IDX websites, new home construction marketing and internet lead generation.

Through his real estate websites and digital marketing efforts, he generates a significant and consistent volume of buyer and seller inquiries.

His primary consumer platform, Local Real Estate Online, is designed to connect buyers and sellers with property listings, local market information, new construction opportunities and real estate professionals who can help them take the next step.

Historically, however, generating the lead has only been the beginning of the challenge.

Internet consumers often begin searching for real estate months before they are ready to speak with an agent. Successfully converting those consumers requires persistent follow-up, sophisticated nurturing and the ability to recognize when someone transitions from casually browsing homes to becoming an actual real estate opportunity.

Solving that problem became one of the biggest factors behind Lotte's decision to return to eXp.

And that's where Tristan Horn enters the picture.

Tristan Horn: Building the Conversion Engine Behind the Leads

Tristan Horn is a digital marketing and lead-generation specialist who has spent much of his career developing marketing systems specifically for the real estate industry.

Horn studied finance and economics at Grand Canyon University before discovering his passion for digital marketing and lead generation. He eventually began working alongside Arizona real estate broker Alan Kushmakov, where Horn says he helped more than 100 real estate agents grow their businesses through lead-generation strategies and innovative marketing systems.

Horn and Kushmakov later co-founded Modern Day Brokerage, expanding their work with real estate agents and brokerages across the country.

For Lotte, however, one of Horn's most exciting developments is an advanced internet lead conversion system designed to address one of the industry's most persistent challenges:

Generating an internet lead is relatively easy. Consistently converting that lead into a closing is incredibly difficult.

According to performance results shared with Lotte, Horn's internet lead conversion system has achieved overall lead-to-closing conversion rates of approximately 2% to 5% in certain applications — an impressive level of performance for internet-generated real estate leads in today's market.

That immediately caught Lotte's attention.

Lead generation happens to be one of Lotte's greatest strengths.

Now, he intends to combine the two.

Lotte's digital marketing and website infrastructure can generate consumers at the top of the funnel, while Horn's conversion methodology can help nurture those consumers, identify intent and move qualified opportunities toward conversations with real estate agents.

That combination is becoming the foundation for a new initiative Lotte calls the eLead Referral Engine.

Introducing the eLead Referral Engine

Our Leads. Your Closings.

The concept behind the eLead Referral Engine is straightforward:

Generate the lead. Nurture the relationship. Identify the opportunity. Connect the consumer with an agent when they're ready.

Traditional internet lead programs frequently provide an agent with a name, email address and phone number immediately after a consumer registers on a website.

The agent then assumes responsibility for everything that happens afterward.

That may mean months of phone calls, text messages, emails and follow-up with consumers who aren't yet ready to buy or sell.

The eLead Referral Engine is being designed to reverse that relationship.

Instead of immediately handing raw internet leads to agents, the system will work those consumers through an ongoing conversion process designed to nurture the relationship and identify when someone demonstrates genuine intent.

The process is designed to move consumers through a progression:

Internet Lead → Nurture & Follow-Up → Engagement → Qualified Opportunity → Agent Introduction → Closing

A buyer may request a showing.

Another may begin asking questions about financing or new construction.

A homeowner may request information about their property's value or indicate that they are considering selling.

Those are the moments the system is being built to identify.

Once that occurs, the consumer can be connected with an appropriate real estate professional.

The distinction is important.

The agent isn't simply receiving another internet lead. The agent is receiving a warmed-up referral opportunity.

“My goal isn't to hand an agent 100 internet leads and tell them to start dialing,” Lotte said. “I want our systems doing the heavy lifting on those 100 leads and identifying the people who are actually raising their hands and saying, ‘Yes, I'm ready to talk to an agent.’ That's when we make the introduction.”

Building an Alternative to Traditional Internet Lead Programs

Lotte believes the eLead Referral Engine could ultimately provide agents with an independently generated referral source capable of competing with some of the real estate industry's largest lead and referral platforms.

One model Lotte points to is Zillow Flex.

The appeal of programs such as Flex isn't simply the source of the consumer inquiry. It's the structure: agents can receive consumer connections without bearing the traditional upfront cost of purchasing large quantities of internet leads, with referral or success fees associated with closed transactions.

Lotte wants to apply a similar concept to his own lead-generation infrastructure while adding an extensive nurturing layer before opportunities reach participating agents.

His objective is for agents receiving qualified eLead Referral Engine opportunities to ultimately convert approximately 10% to 20% of those handoffs into closed transactions, although actual performance will vary based on lead source, consumer readiness, market conditions, agent follow-up, experience and numerous other factors.

That target is intentionally different from the overall 2% to 5% lead-to-closing performance Lotte says has been achieved through Horn's conversion methodology.

The first percentage measures performance across the much larger pool of raw internet leads entering the system.

The second measures conversion only after the system has identified a consumer as a qualified opportunity and connected that person with an agent.

“The part of the Zillow Flex concept that interests me is the model,” Lotte said. “Rather than spending thousands of dollars upfront and hoping those leads eventually turn into business, the agent receives opportunities farther along in the process and the economics are tied to successful closings.”

“That's what I want to create with the eLead Referral Engine — except we're building our own lead-generation and conversion infrastructure behind it.”

A National Brokerage Creates a Path Beyond Ohio

Another important reason eXp Realty fits Lotte's long-term vision is the company's national footprint.

Because eXp operates across the United States, Lotte sees an opportunity to build relationships with agents in other states and eventually extend the eLead Referral Engine beyond Ohio.

That matters because online real estate consumers are not always confined to one market.

Buyers relocate.

Sellers move across state lines.

Investors purchase in multiple markets.

Families often need an agent in one state while selling a home in another.

A national brokerage creates the ability to develop relationships with experienced local agents in those markets and build a referral network that follows the consumer wherever their real estate needs take them.

“My goal has never been to think small with this,” Lotte said. “Ohio is where I’m starting, but eXp gives me the ability to build relationships with great agents across the country.”

“As the referral engine grows, I want to be able to connect qualified buyers and sellers with strong agents in other states, not just Central Ohio. That creates more value for the consumer and more opportunity for agents within the network.”

For Lotte, that national reach turns the eLead Referral Engine from a local lead program into something that could potentially become a much broader referral platform over time.

Jon Harp: Local Leadership, Systems and a Passion for Coaching Agents

For Lotte, one of the most important pieces of returning to eXp Realty was having strong leadership close to home.

That relationship comes through Jon Harp, a Central Ohio real estate leader whose career has evolved from learning the business from the ground up to helping build systems, train agents and coach real estate professionals toward greater production.

Harp grew up in Northeast Ohio and credits his upbringing, sports background and family with instilling the work ethic and team-oriented mindset that would eventually shape his real estate career.

Rather than entering the industry through a traditional sales role, Harp initially approached real estate from an investment perspective and began reaching out to successful Central Ohio professionals looking for an opportunity to learn the business.

That ultimately connected him with Ryan Ruehle during the early stages of building what would become a highly successful Central Ohio real estate organization.

Harp initially joined the business in an administrative capacity while completing his real estate education and earning his license.

Over the following decade, however, his responsibilities expanded significantly.

He became heavily involved in training newly recruited agents, developing processes and implementing systems designed to help the organization scale.

That experience eventually led Harp toward one of the areas he is most passionate about today: coaching real estate agents.

According to a profile of Harp's career, one of the accomplishments he values most is helping people successfully transition into real estate from entirely different careers — a transition he considers one of the most difficult challenges a new agent can undertake.

His philosophy is simple:

Every agent should have a coach — and every agent should eventually become capable of coaching someone else.

Harp provides ongoing coaching and accountability opportunities for agents within his team and eXp organization, including weekly coaching calls designed to help agents develop better habits, strengthen their businesses and maintain momentum.

For Lotte, that local mentorship fills an important role within the broader group of resources he is assembling.

“Jon brings something incredibly valuable to this equation because he has actually been in the trenches building a real estate organization in Central Ohio,” Lotte said. “He understands what agents struggle with, he has trained agents coming into this business from scratch, and he has helped put the systems and processes in place that allow a high-producing organization to grow.”

“Technology can give somebody tools and leads can give them opportunities, but agents still need leadership, accountability and somebody who understands how to turn all of that into a business. That's where Jon brings tremendous value.”

His team-oriented philosophy also aligns closely with what Lotte hopes to create at eXp.

Rather than simply assembling agents under the same brokerage umbrella, the goal is to create an environment where successful agents actively share what they know with the people coming behind them.

Alan Kushmakov: From Top Producer to Brokerage Builder

Another important relationship behind Lotte's return to eXp is Alan Kushmakov, an accomplished Arizona real estate broker, entrepreneur and coach with more than two decades of industry experience.

According to Kushmakov's published biography, he has personally helped 436 families with their real estate needs while generating approximately $148 million in sales and leading a team of 15 real estate professionals.

Then, in 2020, Kushmakov launched his own brokerage.

What began as a new independent brokerage grew into an organization of more than 300 real estate agents.

Kushmakov's experience also extends beyond traditional residential brokerage into mortgage, title services, real estate investment and short-term property management.

That breadth of experience is particularly valuable to Lotte because the objective isn't simply teaching agents how to close another transaction.

It's helping them build better businesses.

BEST Life Builders: Building More Than Production

Kushmakov is also behind BEST Life Builders, formerly known as Lead Gen Academy.

The training community is built around helping real estate professionals create what it describes as a better business, a better life and better income.

The program includes live weekly Zoom training as well as prerecorded online training and educational resources covering business development, lead generation, conversion and agent growth.

“There is a huge difference between teaching somebody how to sell another house and teaching somebody how to build a business,” Lotte said. “Alan has actually sold at a high level, led agents, built businesses and scaled a brokerage to hundreds of agents. That's the kind of experience I want around me, and it's the kind of experience I want agents I'm working with to be able to learn from.”

Joshua Smith and GSD Mode

Lotte is also aligned within eXp with Joshua Smith, the nationally recognized real estate professional, entrepreneur and creator of GSD Mode.

Smith has built one of the real estate industry's better-known coaching and media brands while simultaneously building a highly productive real estate career.

His GSD Mode Real Estate Coaching Program provides coaching, training, business systems and a private community designed to help agents increase production and build more effective real estate businesses.

The GSD Mode Real Estate Coaching community is private to GSD Mode coaching clients and eXp agent partners, creating another valuable training resource available through Smith's eXp organization.

For Lotte, having access to multiple successful coaches isn't redundant.

It's precisely the point.

“No single person has every answer,” Lotte said. “Someone might be exceptional at lead conversion. Someone else might be exceptional at building teams. Someone else might understand prospecting, accountability, technology or business development better than anybody else.”

“What excites me is being able to put all of those pieces together.”

Building an Agent Ecosystem — Not Just Another Real Estate Team

Lotte emphasizes that the long-term objective isn't simply to build another traditional real estate team.

Instead, he wants to develop an agent ecosystem in which independent real estate professionals can benefit from shared resources, expertise and opportunities while continuing to build businesses of their own.

Depending upon participation and eligibility, those resources may include:

  • Warm buyer and seller referral opportunities through the eLead Referral Engine

  • Advanced internet lead nurturing and conversion systems

  • Weekly live coaching and accountability opportunities

  • Extensive prerecorded training libraries

  • Lead-generation and digital marketing strategies

  • Technology and automation

  • Business-building systems

  • Local Central Ohio leadership and collaboration

  • National referral relationships with agents in other states

  • Access to experienced agents, coaches and entrepreneurs

  • eXp Realty's broader technology, training and agent support resources

The idea is not to force every agent into one system.

It's to give agents more systems from which to choose.

“Different agents need different things at different stages of their careers,” Lotte said. “A newer agent may need leads, scripts, accountability and someone to call when they have questions. An experienced agent might need better systems, automation or a way to create additional opportunities without spending all day prospecting.”

“I want to build an environment where both of those agents can find value.”

eXp Realty's Co-Sponsor Program Creates Even More Possibilities

Another development that made Lotte's return to eXp particularly compelling is eXp Realty's Co-Sponsor Program.

Under eXp's current program, eligible incoming agents may have the opportunity to select both a primary Sponsor and a Co-Sponsor, subject to company policies and eligibility requirements.

The program creates an unusual opportunity for agents to develop relationships with leaders from different parts of the company and potentially benefit from multiple communities, perspectives and areas of expertise.

For an agent choosing Lotte as their primary sponsor, that means the resources available through Lotte's organization don't necessarily have to represent the end of their support network.

They can potentially add another experienced leader outside of that organization as a Co-Sponsor.

One example Lotte points to is Jim Lambright.

Jim Lambright: Decades of Experience, Agent Growth and Grow Global

Lambright brings another entirely different dimension to the collection of resources Lotte hopes agents can surround themselves with.

His real estate career stretches back to 1997, and the Lambright Team's published background says the organization has helped thousands of families with their real estate needs while earning recognition for sales achievement, negotiation and customer service.

The team has also described itself as ranking within the top 1% of Central Ohio real estate professionals by production.

But while the Lambright Team's production history establishes the real estate foundation behind Jim's experience, Lotte sees particular value in another area of Lambright's career:

helping real estate professionals grow their businesses, their networks and their organizations.

Lambright is heavily involved in agent growth and attraction strategies and has developed tools and systems designed to help real estate professionals expand their businesses through relationship building, marketing and agent attraction.

He is also a moderator of Grow Global, a recurring real estate mastermind and training community built around the philosophy:

Grow Your Business. Grow Your Network. Grow Your Life.

The program includes live Zoom mastermind sessions covering topics such as real estate marketing, content creation, personal branding, social media, video, YouTube, business development and strategies for increasing an agent's visibility within their market.

Recent Grow Global sessions, for example, have focused on helping agents identify content that attracts attention, determine which platforms best fit their audiences and use posts, reels, video and YouTube content to position themselves as the go-to real estate professional in their market.

That makes Lambright's expertise highly complementary to the other professionals within Lotte's network.

Tristan Horn brings internet lead conversion.

Jon Harp brings local leadership, systems and accountability.

Alan Kushmakov brings business building and entrepreneurship.

Joshua Smith brings production-focused coaching and GSD Mode.

And Jim Lambright adds another layer focused heavily on agent growth, marketing, networking and building an organization beyond an agent's individual production.

“For me, Jim is another perfect example of why the Co-Sponsor Program is so interesting,” Lotte said. “He has decades of experience in this industry, he's been part of building a highly successful Central Ohio real estate business, and he brings an entirely different skill set around agent attraction, marketing and growing an organization.”

“If somebody joins eXp with me as their sponsor and Jim makes sense as their Co-Sponsor, that agent doesn't have to choose between what we're building and what Jim is building. They can potentially benefit from both.”

That flexibility represents one of the biggest differences Lotte sees in today's eXp model.

“Agents shouldn't have to choose between great mentors,” Lotte said. “If I can help somebody with internet leads and lead generation, Jon can help with local production and accountability, Tristan can help with conversion, Alan can help with business development, Joshua can help with coaching, and someone like Jim can help them think bigger about marketing, networking and growing an organization — that's an incredible amount of knowledge surrounding one agent.”

Why Return to eXp Realty Now?

Lotte was previously affiliated with eXp Realty and ultimately chose to leave the company.

So why return?

Because this time, he believes both the opportunity and his strategy are fundamentally different.

“The first time I was at eXp, I don't think I fully took advantage of what the model could become,” Lotte said. “Coming back this time, I have a completely different strategy.”

“I'm not returning because of one tool, one compensation program or one person. I'm returning because I can see how all of these pieces can work together.”

Those pieces include Lotte's established internet lead-generation infrastructure, Horn's conversion systems, Harp's local leadership, Kushmakov's BEST Life Builders training, Smith's GSD Mode coaching, Lambright's Grow Global resources and the broader technology, training and collaborative environment available through eXp Realty.

And increasingly, Lotte's focus isn't simply on what those resources can do for his own production.

It's about what happens when those resources are combined and made available to other agents.

From Generating Leads to Creating Opportunities

For years, Lotte's digital real estate strategy has focused heavily on generating consumer traffic and leads.

The next evolution is much more ambitious.

Rather than simply generating more leads, the objective is to build an end-to-end real estate conversion infrastructure:

Website Visitor → Internet Lead → Automated & Personal Nurturing → Engagement → Qualified Opportunity → Agent Introduction → Closing

That changes the question from:

“How many leads can we generate?”

to:

“How many real opportunities can we create for agents?”

For Lotte, that's the opportunity that makes returning to eXp exciting.

“If we can combine a large volume of internet leads with a great conversion system, then combine that with talented agents and world-class coaching, we've created something much more valuable than a database full of names and phone numbers,” Lotte said.

“We've created an engine.”

A New Chapter Begins

Effective August 31, 2026, Christopher Lotte is officially affiliated with eXp Realty in Ohio and will continue expanding his consumer-facing real estate platform, Local Real Estate Online.

At the same time, development and expansion of the eLead Referral Engine will become a major focus as Lotte begins integrating his existing digital lead-generation infrastructure with advanced nurturing and conversion systems.

Lotte also plans to expand the network of real estate professionals receiving qualified buyer and seller opportunities as the system grows — first throughout Ohio and, over time, into additional states through eXp Realty's national network of agents.

For agents considering eXp Realty, Lotte believes the question should extend beyond simply comparing brokerage fees, commission splits or technology.

It should also include the people, systems, opportunities and relationships an agent will have around them after they join.

“Real estate agents have more brokerage choices than ever before,” Lotte said. “There are plenty of companies where you can hang your license.”

“What I'm interested in building is something different — an environment where agents can have leads to work, systems to convert them, successful people to learn from, technology that makes them more efficient and the freedom to build the kind of real estate business they actually want.”

For Lotte, returning to eXp Realty isn't simply a return to a former brokerage.

It's the beginning of what he plans to build next.

Interested in Learning More About Joining eXp Realty?

Real estate professionals who would like to learn more about why Lotte returned to eXp Realty, the coaching and training resources available within his network, the eLead Referral Engine, sponsorship and co-sponsorship opportunities, and how the overall eXp model can support an agent's business can visit:

Why Join eXp Realty?

The page will provide a deeper look at the programs, tools, training, lead opportunities and relationships available to agents who are considering making a move.

Agents can also learn more about Lotte's real estate business, digital marketing platform and consumer resources at LocalRealEstateOnline.com.


About Christopher Lotte

Christopher Lotte is a Central Ohio real estate professional specializing in digital real estate marketing, internet lead generation, search engine optimization and new home construction.

Through Local Real Estate Online, Lotte has developed an extensive online real estate platform designed to connect home buyers and sellers with property listings, local market information, new construction opportunities and qualified real estate professionals.

In 2026, Lotte returned to eXp Realty with a renewed focus on combining large-scale internet lead generation, sophisticated lead nurturing, agent coaching and referral opportunities through the development of the eLead Referral Engine.

About the eLead Referral Engine

The eLead Referral Engine is a real estate lead nurturing and referral initiative being developed by Christopher Lotte to transform internet-generated buyer and seller inquiries into qualified opportunities for participating real estate professionals.

Built around the concept “Our Leads. Your Closings.”, the system combines digital lead generation, long-term nurturing, automated follow-up and human engagement with the goal of connecting consumers with real estate professionals when they are ready to take the next step in their real estate journey.

The long-term vision is to build a referral network extending beyond Ohio by developing relationships with qualified real estate professionals in other states through eXp Realty's national brokerage network.

About eXp Realty

eXp Realty is a national and global cloud-based real estate brokerage and a core subsidiary of eXp World Holdings, Inc. The company provides real estate professionals with a virtual brokerage environment along with technology, education, training and collaborative opportunities designed to support agent growth.

Its broad geographic footprint also allows agents to develop referral and professional relationships across state lines, creating opportunities for collaboration well beyond an individual agent's local market.

Performance & Program Disclaimer

Production figures and biographical information attributed to individuals in this announcement are based on publicly available biographies or information provided by the individuals and their organizations. Lead-conversion percentages referenced in connection with specific systems reflect reported historical performance in certain applications and are not guarantees of future results. The 10%–20% qualified-referral conversion range discussed for the eLead Referral Engine represents a program objective and not guaranteed performance. Individual results will vary based on market conditions, lead source, consumer behavior, agent experience, follow-up and other factors.

Programs, training, referral opportunities, sponsorship relationships, co-sponsorship eligibility and other resources described in this announcement may be subject to separate requirements, terms and eXp Realty policies and may change over time.
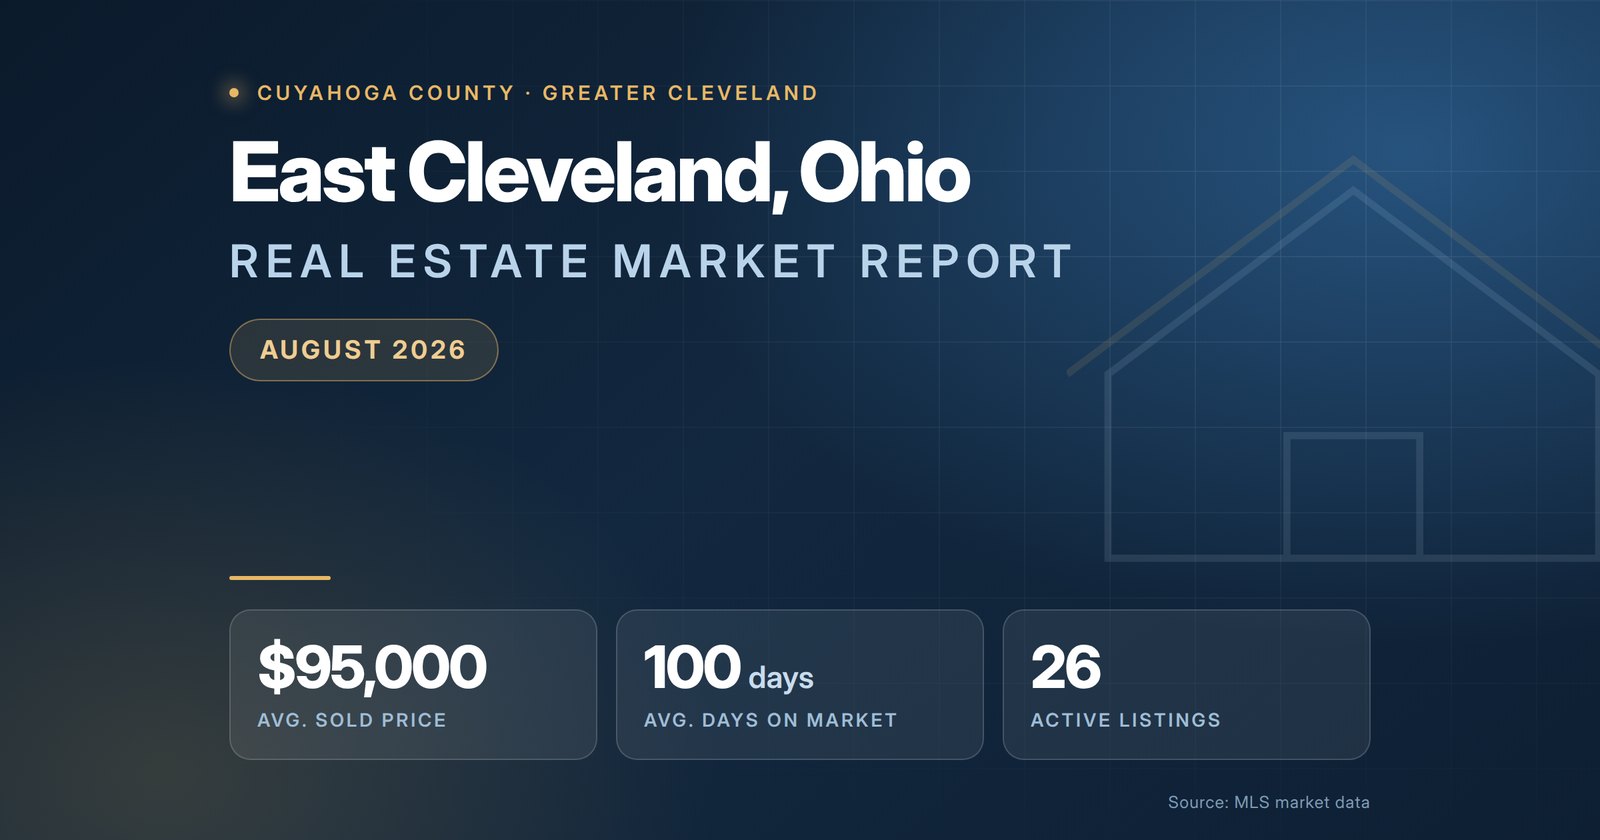
Aug. 31, 2026

Circleville Ohio Real Estate Market Report – August 2026

Circleville Ohio Real Estate Market Report August 2026

Circleville closed 166 sales recently in a city of 14,142 — among the highest turnover relative to population anywhere in this series. It is also one of the few genuinely balanced markets in Central Ohio: 54 homes available against 49 under contract, sales landing 1% below asking, and a pace of 87 days from listing to contract. Neither buyers nor sellers hold a decisive advantage here, which after two years of Columbus-area scarcity is worth noticing.

Circleville Ohio Market Snapshot – August 2026

Active ListingsUnder ContractRecent ClosingsAvg Sale Price
5449166$293,223
Median List (Active, residential)Avg Price / Sq Ft (Sold)Sale-to-List RatioAvg Days on Market
~$320,000$17899.0%87 (sold)
Avg Beds (Sold)Avg Baths (Sold)Avg Living Area (Sold)Est. Monthly P&I
3.22.11,740 sq ft$1,506

Source: Circleville, Ohio Real Estate Market Report, Columbus MLS data as of August 2026. Active figure shown as a median of residential listings rather than the raw average, which includes acreage — see below. Monthly payment assumes 20% down at 6.65%, principal and interest only.

A Note on the Active Listing Average

The market report page shows an average active asking price of $397,118 against an average recent sale of $293,223. That $104,000 gap looks alarming until you see what is in the active segment.

This is Pickaway County, and the active listings mix acreage and land parcels in with houses. A small number of large parcels — the kind that sit on the market for many months, which is also why the reported active days-on-market figure is 95 — pull the average well above the residential range.

Looking at the individual listings clarifies it. The 51 most recently listed active properties have a median asking price of about $320,000, an average of $344,102, and a maximum of $875,000. None exceeds a million dollars. That is the range a home buyer is actually shopping.

The sold data is the reliable measure and is what the rest of this report uses: 166 closings, $293,223 average, $178 per square foot, 99.0% of list.

A Balanced Market in an Unbalanced Metro

Fifty-four active listings against forty-nine under contract gives a ratio of 1.10. Sales are closing at 99.0% of list — about $2,967 below asking.

Across most of the Columbus metro, buyers this year have faced the same problem: not enough homes, competing offers, and prices clearing at or above list. Circleville is where that stops. There is inventory to look at, time to consider it, and a modest discount available when you write an offer.

What it costs is pace. Recent closings took 87 days from list to contract — nearly three months, and slower than most of Central Ohio. That is the flip side of a balanced market: without competitive pressure, transactions take longer to form.

166 Closings Is the Real Story

One hundred sixty-six recent closings in a city of 14,142 is heavy volume — more than several Columbus suburbs with two or three times the population.

Circleville works as two things at once. It sits on the US-23 corridor directly south of Columbus, close enough to function as a commuter option, and it has a substantial manufacturing and distribution employment base of its own. That combination produces steady, local, year-round transaction volume rather than the boom-and-lull pattern of a pure bedroom community.

For a buyer or seller, high volume means comparable sales genuinely exist. Valuations here rest on real evidence rather than on three transactions from last spring.

The County-Seat Discount

Circleville and Lancaster — the Fairfield County seat to the east — are priced almost identically: $178 per square foot against $176, with average sale prices of $293,223 and $290,015.

Grove City, the Franklin County suburb sitting between them and downtown Columbus, closes at $195 per square foot. That is roughly a 9% premium for the closer address and the Franklin County school districts.

Nine percent is a real number but a smaller one than most buyers assume. On a 1,900-square-foot home it works out to about $32,000. Whether the commute difference is worth that is a genuine question, and worth answering with actual numbers rather than an assumption that the outlying county seats are dramatically cheaper.

Central Ohio Context and Mortgage Rates

Columbus REALTORS reported a July 2026 metro median sale price of $350,000, up 2.3% year over year, on 3,083 sales with 6,193 active listings and roughly 2.4 months of supply. Circleville closes about $57,000 below the metro median with a noticeably looser supply picture.

Statewide, the Ohio REALTORS July 2026 report put the median Ohio sale price at $285,000, up 3.6% year over year, with 3.72 months of supply. Circleville sits just above the statewide median.

Freddie Mac reported the 30-year fixed averaging 6.65% and the 15-year 5.95% as of August 20, 2026, a second consecutive weekly decline. On a $234,578 loan that is roughly $1,506 a month in principal and interest.

Circleville Market Breakdown by Property Type

With acreage a real part of this market, filtering by property type matters:

Featured Circleville Neighborhoods

Circleville is built around its historic circular street plan with newer subdivisions at the edges:

Circle Hills · Crossings At Clifton Estates · Eastwood Place · Elsea Mobile Park · Garden City · Graystone Villas · Heathergreen Village · Heritage Ponds · Knollwood Village · Logan Elm Village · North Meadows · Northwood Park · Sylvan Village · Walnut Creek Estates

What This Means If You Are Buying

Filter land out before drawing conclusions. The raw active statistics include acreage parcels that have nothing to do with the house you are shopping for.

Use the time you have. With 54 listings and an 87-day pace, you can see enough homes to compare properly. That is a real advantage over most of the Columbus metro right now.

Negotiate, modestly. The average buyer got about 1% off. Ask for it; do not expect five.

Price the Grove City comparison honestly. The premium for moving closer to Columbus is about 9% per square foot — smaller than most people assume. Run the numbers on both before deciding the commute is worth the savings.

What This Means If You Are Selling

Volume is on your side — 166 recent closings means real buyers. The constraint is that fifty-three other homes are competing for them and buyers are under no time pressure.

Price accurately from day one. In a balanced market there is no competitive dynamic to lift an aggressive price, and with an 87-day average pace, a listing that starts too high can burn most of a season before the reduction that was always going to be necessary.

Anchor at the $178 per square foot benchmark and adjust honestly for condition and lot. Presentation matters when buyers have genuine alternatives.

How Circleville Compares Nearby

  • Commercial Point — $431,948 average sale, 26 active, 14 pending, $200/sq ft
  • Grove City — $377,528 average sale, 158 active, 151 pending, $195/sq ft
  • South Bloomfield — $343,667 average sale, 24 active, 10 pending, $160/sq ft
  • Circleville — $293,223 average sale, 54 active, 49 pending, $178/sq ft
  • Mount Sterling — $293,792 average sale, 10 active, 11 pending, $169/sq ft
  • Lancaster — $290,015 average sale, 167 active, 92 pending, $176/sq ft
  • Washington Court House — $234,336 average sale, 70 active, 39 pending, $154/sq ft

South Bloomfield is the interesting one in this group: its average sale price is $50,000 higher than Circleville’s but its price per square foot is 10% lower, because it sells substantially larger homes — 2,188 square feet against 1,740. For a buyer whose priority is space per dollar in Pickaway County, that is where to look.

Washington Court House is the affordability step down at 16% less per foot, further out along the US-35 corridor.

Frequently Asked Questions

What is the average home price in Circleville, Ohio?

Recent closed sales in the Circleville market area averaged $293,223, or about $178 per square foot on an average of 1,740 finished square feet. That is roughly $57,000 below the Columbus metro median of $350,000 and about $8,000 above the Ohio statewide median.

How much is the monthly payment on an average Circleville home?

At the $293,223 average closing price with 20% down and the Freddie Mac 30-year average of 6.65% as of August 20, 2026, principal and interest come to roughly $1,506 per month on a $234,578 loan. Pickaway County property taxes and homeowners insurance are additional.

Why does the market report page show an average asking price near $397,000?

Because the active-listing segment mixes acreage and land parcels in with houses, and a small number of large Pickaway County parcels pull the average well above the residential range. Among the 51 most recently listed active properties the median asking price is about $320,000 and the maximum is $875,000 — that is the range a home buyer is actually shopping.

Can you negotiate on price in Circleville?

Modestly. The average sale closed at 99.0% of list — about $2,967 below asking. With 54 active listings and homes taking 87 days to reach a contract, buyers have time and a small amount of room.

Is Circleville a buyer or a seller market right now?

Close to balanced. The active-to-pending ratio is 1.10 — 54 available against 49 committed — and sales are closing about 1% under asking. Neither side has a decisive advantage, which is unusual for the Columbus metro right now.

How long do homes take to sell in Circleville?

Recent closings averaged 87 days from list to contract — nearly three months, and slower than most of Central Ohio. Pending sales are averaging 69 days. Sellers should plan a season rather than a month.

How does Circleville compare to Grove City and Lancaster?

Circleville and Lancaster are priced almost identically — $178 per square foot against $176 — and both close near $290,000. Grove City, the Franklin County suburb between them and Columbus, runs $195 per square foot, roughly a 9% premium for the closer address.

Why does Circleville have so many home sales?

One hundred sixty-six recent closings in a city of 14,142 is among the highest turnover relative to population in this series. Circleville sits on the US-23 corridor directly south of Columbus with a real manufacturing and distribution employment base of its own, so it functions both as a commuter option and as its own local market.

Get a Personalized Circleville Market Analysis

Circleville’s published averages mix farmland with houses, which makes the citywide figures unreliable for valuing a home. And in a balanced market with an 87-day pace, the cost of pricing wrong is measured in months.

If you are selling, I will value your home against genuine residential comparable sales — acreage excluded — and give you a realistic timeline rather than an optimistic one. If you are buying, I can filter this market to the houses, tell you where the negotiating room is, and run the Grove City comparison honestly with you.

Contact Christopher Lotte to get started, or browse the full Circleville, Ohio real estate market report for the underlying listing-level data.

Sources: Columbus MLS via the Circleville Ohio Market Report (August 2026) · Columbus REALTORS July 2026 Housing Report · Ohio REALTORS July 2026 Housing Report · Freddie Mac Primary Mortgage Market Survey, August 20, 2026. Sold figures are as reported by the MLS; the active median was calculated from the individual listings to exclude acreage parcels. Not a substitute for a professional valuation.

Christopher Lotte, Realtor

Aug. 31, 2026

Willowick Ohio Real Estate Market Report – August 2026

Willowick Ohio Real Estate Market Report August 2026

Willowick is the cheapest per square foot of the Lake County lakeshore communities at $139, and the most supply-constrained. There are 18 homes for sale against 28 already under contract — more than one and a half homes spoken for for every one a buyer can walk into. Cheap and scarce at the same time is an unusual combination, and it is producing exactly what you would expect: sales closing above asking.

Willowick Ohio Market Snapshot – August 2026

Active ListingsUnder ContractRecent ClosingsAvg Sale Price
1828100$217,084
Avg List Price (Active)Avg Price / Sq Ft (Sold)Sale-to-List RatioAvg Days on Market
$277,983$139101.2%49 (active)
Avg Beds (Sold)Avg Baths (Sold)Avg Living Area (Sold)Est. Monthly P&I
3.01.91,619 sq ft$1,115

Source: Willowick, Ohio Real Estate Market Report, MLS Now data as of August 2026. Monthly payment assumes 20% down at 6.65%, principal and interest only.

Eighteen Available, Twenty-Eight Committed

The active-to-pending ratio in Willowick is 0.64, one of the tightest in Northeast Ohio this month. Add the 100 recent closings and the picture sharpens: roughly five and a half homes have sold for every one currently on the market.

Willowick is a small, fully built-out lakeshore city. There is no meaningful capacity to add housing here — the stock turns over rather than expands. When affordability draws steady demand into a fixed supply, this is what the numbers look like.

Sales are landing at 101.2% of list, about $2,522 over asking. It is a modest premium in dollar terms, but at a $217,000 average it is the market telling you that buyers are competing rather than negotiating.

The Most Affordable Lakeshore Address in the Corridor

Set the western Lake County communities side by side on the measure that matters:

  • Willoughby — $279,735 sale, $162/sq ft
  • Mentor — $298,916 sale, $161/sq ft
  • Eastlake — $225,639 sale, $149/sq ft
  • Wickliffe — $216,839 sale, $146/sq ft
  • Willowick — $217,084 sale, $139/sq ft

Willowick and Wickliffe close within $250 of each other on average sale price, but Willowick is 5% cheaper per square foot — meaning the same money buys slightly more house. Against Willoughby the gap is 17%, in the same school corridor with the same Route 2 access.

For a buyer working within a fixed monthly budget on Cleveland’s eastern lakeshore, Willowick is where the arithmetic works hardest. The catch is that everyone else has worked out the same thing, which is why there are eighteen listings.

One Thousand One Hundred Fifteen Dollars a Month

At the $217,084 average closing price with 20% down, principal and interest run about $1,115 a month on a $173,667 loan — for a three-bedroom home averaging 1,619 finished square feet in a lakeshore suburb fifteen miles from downtown Cleveland.

Two honest caveats. Lake County property taxes and homeowners insurance are meaningful additions and should be verified per address rather than estimated from the sale price. And at $139 per square foot you are buying largely postwar housing stock, where the roof, furnace, electrical, and plumbing determine whether an affordable house is genuinely affordable. Budget for a thorough inspection and for what it turns up.

Ohio Context and Mortgage Rates

Statewide, the Ohio REALTORS July 2026 report put the median Ohio sale price at $285,000, up 3.6% year over year, across 12,723 sales, with 39,641 active listings and 3.72 months of supply. Willowick closes about $68,000 below that median, and its supply picture bears no resemblance to the statewide one — eighteen listings against a hundred recent closings is a matter of weeks.

Freddie Mac reported the 30-year fixed averaging 6.65% and the 15-year 5.95% as of August 20, 2026, a second consecutive weekly decline. On a $173,667 loan that is roughly $1,115 a month in principal and interest, with the move from 7.00% to 6.65% worth about $41 a month.

Willowick Market Breakdown by Property Type

What This Means If You Are Buying

Be ready before you look. Eighteen listings against twenty-eight already under contract means the constraint is response time, not selection. Full underwriting approval rather than a prequalification letter is what makes an offer competitive.

Do not plan on a discount. The average buyer paid $2,522 over asking. Coming in under list on a well-priced Willowick home is generally a decision not to buy it.

Inspect the postwar stock carefully. The purchase price is the smaller part of the decision at $139 per square foot. Mechanical systems are the larger part.

Have a fallback ready. Eastlake sits immediately adjacent with nearly twice the inventory and a meaningful share of it having sat long enough to negotiate on. If Willowick does not open up, that is where to look next.

What This Means If You Are Selling

These are strong conditions. Seventeen other homes compete with you citywide, buyers are paying above asking, and inventory is being absorbed considerably faster than it is replaced.

Price at the market and let buyers compete — that is the mechanism producing the 101.2% average, and it only works if your home is priced to be toured. In an eighteen-listing market, a home that stalls is conspicuous because there is so little else for buyers to look at.

Expect roughly two months from listing to contract, and have your Lake County disclosures ready before you go active.

How Willowick Compares Nearby

  • Mentor — $298,916 average sale, 81 active, 74 pending, $161/sq ft
  • Willoughby — $279,735 average sale, 39 active, 25 pending, $162/sq ft
  • Eastlake — $225,639 average sale, 33 active, 29 pending, $149/sq ft
  • Willowick — $217,084 average sale, 18 active, 28 pending, $139/sq ft
  • Wickliffe — $216,839 average sale, 18 active, 19 pending, $146/sq ft

Eastlake is the practical alternative and behaves quite differently. It carries 33 active listings against Willowick’s 18, and its unsold inventory has been sitting an average of 78 days — considerably longer than the 49 days in Willowick. A buyer looking for negotiating room rather than the lowest per-foot price will find more of it there.

Mentor is the step up in both price and selection, with 81 active listings at 16% more per square foot.

Frequently Asked Questions

What is the average home price in Willowick, Ohio?

Recent closed sales in the Willowick market area averaged $217,084, or about $139 per square foot on an average of 1,619 finished square feet. That is the lowest per-square-foot figure among the western Lake County lakeshore communities and roughly $68,000 below the Ohio statewide median.

How much is the monthly payment on an average Willowick home?

At the $217,084 average closing price with 20% down and the Freddie Mac 30-year average of 6.65% as of August 20, 2026, principal and interest come to roughly $1,115 per month on a $173,667 loan. Lake County property taxes and homeowners insurance are additional.

Is Willowick a buyer or a seller market right now?

Firmly a seller market. There are just 18 active listings against 28 already under contract — a ratio of 0.64, meaning more than one and a half homes are spoken for for every one available — and sales are closing at 101.2% of list, about $2,522 over asking.

Why is there so little for sale in Willowick?

One hundred homes have closed recently against eighteen currently available. At that pace the entire active inventory represents only a few weeks of transaction volume. Willowick is a small, fully built-out lakeshore city with essentially no capacity to add housing, and its affordability relative to the rest of the corridor keeps demand steady.

How much can you negotiate off asking price in Willowick?

Very little. The average buyer paid $2,522 above asking. With eighteen listings citywide and more homes under contract than available, an under-asking offer on a well-priced Willowick home usually means losing it.

How long do homes take to sell in Willowick?

Recent closings averaged 61 days from list to contract, pending sales 65 days, and homes currently for sale have been listed 49 days. About two months is the realistic expectation.

How does Willowick compare to Eastlake and Willoughby?

Willowick is the most affordable of the three on both measures. At $139 per square foot it sits below Eastlake ($149) and well below Willoughby ($162), with an average sale price of $217,084 against $225,639 and $279,735. It is also the tightest of the three on supply — 18 active against 28 pending, where Eastlake has 33 against 29.

Is Willowick a good place to buy a first home?

The monthly figure of about $1,115 in principal and interest puts it within reach for many first-time buyers, and 100 recent closings show a liquid market. The obstacles are selection — eighteen listings — and competition, since sales are clearing above asking. Older postwar housing stock also means the inspection matters; verify Lake County taxes and condition on any specific address.

Get a Personalized Willowick Market Analysis

In an eighteen-listing market, the difference between buying in Willowick and not buying in Willowick is usually how quickly you hear about a home and how prepared you are when you do.

If you are buying, I can get you notified the day a Willowick home lists and out to see it immediately. If you are selling, I will price your home to draw the competition that produces this market’s above-asking closings, and tell you honestly what condition items are likely to come up in inspection on a home of its age.

Contact Christopher Lotte to get started, or browse the full Willowick, Ohio real estate market report for the underlying listing-level data.

Sources: MLS Now via the Willowick Ohio Market Report (August 2026) · Ohio REALTORS July 2026 Housing Report · Freddie Mac Primary Mortgage Market Survey, August 20, 2026. Figures are averages for the Willowick market area as reported by the MLS and are not a substitute for a professional valuation.

Christopher Lotte, Realtor